Figure 5.2. (a) NCTE torque transducer with replacement GKN female coupler, (b) Original NCTE
Clamp-type female PTO coupler.
Operating speeds of 3600 rev∙min-1 and torque measurements of up to 5000 N∙m
were possible with this sensor. The sensor can be factory set to analog 0 - 10 V, 4 – 20 mA, or CANBUS outputs. For this study analog 0 -10 V was selected for expandablecompatibility with further instrumentation of other measurements of the implement parameters.
1.2.2 Device limitations
The clamp-type coupler (Fig. 5.3b) minimized the tolerances compared to the
Datum sensor and had a run-out of <0.127 mm (0.005 in.). However, the implement PTO shaft caused the run-out to increase to ≈0.635 mm (0.025 in.). Vibration was createdthroughout the machine by the run-out. Similar solutions to the Datum sensor were suggested to the manufacturer and they were able to provide a simpler solution of replacing the coupler with a GKN coupler (601681, GKN Walterscheid GmbH, Lohmar, Germany). The GKN coupler had a more robust clamping method. The recessed screw, one-piece split shaft GKN coupler used bolts threaded into the coupler to provide a greater clamping force as compared to the NCTE (Fig. 5.3a).With the replacement coupler the run-out was 0.076 mm (0.003 in.) under no load and 0.381 mm (0.015 in.) connected to the implement shaft. Vibration was still present, but the relative intensity was not untypical of agricultural implement operations.
Calibration Equipment
The Nebraska Tractor Test Lab (NTTL) provided a 522 kW Eddy Currentdynamometer (Dyno) (DM-2025DG, Dyne Systems Inc., Jackson, Wisc.) as the
calibration fixture. The resistance load created by the Dyno was measured by an Interface load cell (load cell) (1110BF-2K, Interface, Inc., Scottsdale, Ariz.). The Dyno and load cell were calibrated as a system semi-annually using procedures traceable to NIST. The load cell had two ports, one connected to the DAQ hardware for measurement purposes and the other was connected to the dynamometer controller.
DAQ Hardware and Software program
Data acquisition was accomplished using a National Instruments (NI) cDAQ board (NI cDAQ 9174, National Instruments Corporation, Austin, Texas). The DAQ was a portable 4-slot chassis for use with NI C series I/O modules. The chassis had the capability to handle multiplexed analog I/O, thermocouples, and digital I/O. A universal analog module (NI 9219, National Instruments Corporation, Austin, Texas) capable of measuring analog voltages from amplified bridge strain gages, thermocouples, load cells, and other analog powered sensors, was used to measure the analog output of the DUT. The digital speed signal was measured and recorded using a digital input module capable of sinking or sourcing up to 4 digital input channels (NI 9435, National Instruments Corporation, Austin, Texas). The Dyno used a digital multi-loop dynamometer (Dyno controller) (Inter-Loc V, Dyne Systems, Inc., Jackson, Wisc.) to control the torque applied or to control the speed of the PTO shaft. The Dyno data acquisition board (NI cDAQ 9188, National Instruments Corporation, Austin, Texas) was an 8-slot chassis with
NI C series I/O modules to measure analog current (±20 mA) and analog input voltage (±10 V). Analog output voltage (±10 V), thermocouple signal measurements (± 78 mV), provide high speed digital I/O (5 V), digital input (250 VAC/DC), and digital output (24 V) were achievable with the Dyno DAQ. An analog input channel was used to measure the torque applied to the load cell and the high-speed digital I/O used a counter to measure the magnetic speed sensor of the Dyno. The remaining analog and digital I/O channels were used to measure the other tractor operating parameters (e.g., intake temperature, oil pressure, engine speed, fuel flow rate).
Separate LabVIEW programs were utilized for the display and logging of the
measurement data for the DUT and Dyno. The Dyno program was developed by the NTTL for official OECD tractor testing. The front panel of the virtual instrument (VI)used for the DUT during calibration was developed as part of this study (Fig. 5.4) andallowed the user to input test information to be saved as the title of the data log file (e.g., Replication 1, Torque 1). PTO speed (rev∙min-1) and torque (V) are displayed to the user in real-time with a table of values to be saved to the log file. The Log Data Boolean control allowed the user to log the raw 1 Hz data during specific test durations. When the Stop control was selected the data in the table was published to the data log file and the VI terminated execution. 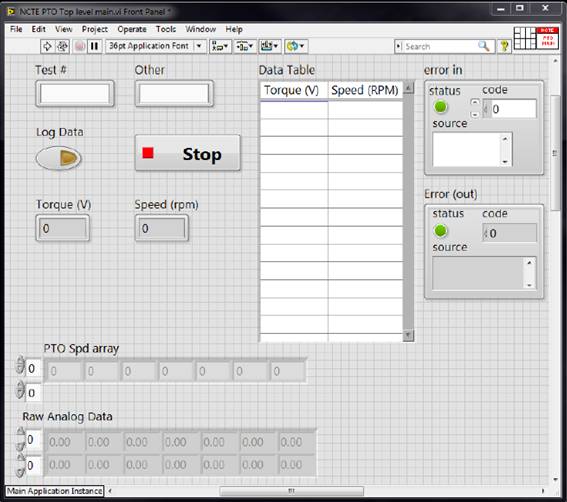
Дата добавления: 2018-04-15; просмотров: 202; Мы поможем в написании вашей работы! |

Мы поможем в написании ваших работ!