FE analysis of the FS-seal and DB-seal
Stress analysis was presented in the first Report. Life aspects are added below. The same models were used (additional two springs on ID don’t influence on results).
FE-models of FS-seal and DB-seal (including gland dimensions) are Fig.2.1 and Fig.2.2.

Fig.2.1
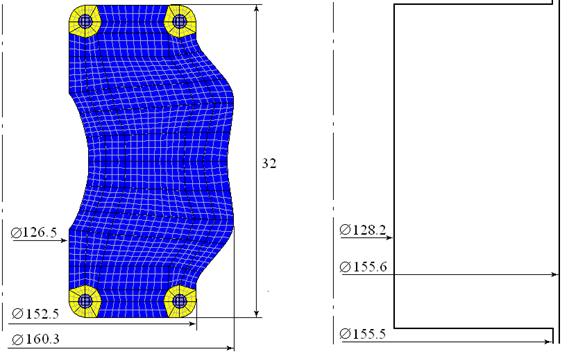
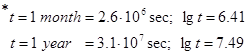
Fig.2.2
Thermal softening of rubber (modulus decreasing), thermal expansion and relaxation processes were add in analysis.

Fig.2.3
Stress deviator and life distributions after relaxation is in Fig. 2.3 for FS-seal at 150C and 70 MPa.
Stress deviator and life distributions after relaxation is in Fig. 2.4 for DB-seal at 150C and 70 MPa.

Fig.2.4
Brief from theoretical basis of life estimation
Thermal dependence of elastic properties
C ij are the elastic constants, connection with the Young’s modulus is –  MPa. Elastic constants C ij for compound E 50189 are C10 = 1.592 MPa, C02 = 0.81 MPa at 20C.
For determination of the temperature effect of rubber softening the experiments of tension on dumbbells at different temperature were carried out. Young's modulus is determined from the initial part of the curve in Fig. 3.1.

Fig. 3.1
E = 5.01 MPa at 150C (practically two times softer).
Viscoelasticity at different temperatures
In this case stress -strain relation is expressed using the Maxwell model
 ,
,
where  ‑ the stress rate tensor of model number k,
  ‑ the rate of elastic stresses tensor of model number k,
  ‑ the stresses tensor of model number k. For the description of viscoelastic material behavior the constants of viscosity are used:
  -relaxation time of model number k and Kk - fraction of loading for model number k in the initial time. The relation of this parameter with the linear theory is expressed as

where n – where total number of Maxwell models,  ‑ Young's modulus of model number k. To obtain the constants of viscosity , Kk the curve relaxation is used, where on the vertical axis the load related to initial load is plotted, i.e. to load obtained from an elastic problem. . The rate of relaxation significantly depends on temperature, i.e.
  . To be exact
  , where A1, A2 - constants. To determine this dependence a second curve of relaxation is plotted at other temperature. The values of
  in calculations are determined automatically depending on the temperature and, if temperature varies, also the relaxation time varies.
|
|
|
As result of processing the experimental data of cylinders with compound relaxation, the constants of viscosity are obtained (table 2). Fig. 3.2 shows the experimental and analytical relaxation curves (а – T = 20 °C, b – T = 100 °C ).
| Table 2 | |||||||
| Model | 1 | 2 | 3 | 4 | 5 | 6 | Total relaxation time trelax |
| Ki | 0.213 | 0.075 | 0.07 | 0.065 | 0.02 | 0.01 | |
| i, sec T=20 °С | 4.375 | 77.5 | 200 | 
| 
| 
| 
|
| i, sec T=100 °С | 3 | 9 | 25 | 500 | 
| 
| 
|

Fig. 3.2
Life estimation
According to the thermofluctuation theory, fracture represents the process of thermofluctuation formation and accumulating of microscopically breaking of continuity in a solid (formed micro- crack). When the concentration of micro-crack reaches extreme magnitude, their confluence in trucking fracture (macro-crack) takes place, which results to separation of the body into parts. The lifetime of rubber parts as a factor of time before the formation of the first fracture is a function of stresses and temperature [3, 4, 6, 7].
Дата добавления: 2019-09-13; просмотров: 174; Мы поможем в написании вашей работы! |

Мы поможем в написании ваших работ!