Chapter 2. Life analysis of FS-seal and DB-seal.
Life estimation of CP’s seals.
Report.
According to the request of FMC Kongsberg Subsea AS
Friction and wear laboratory, St Petersburg State Polytechnical University. 8 November 2004.
Report was prepared by Lazarev S.
Results of analysis are presented in the following sequence (contents):
Page
Chapter 1. Prediction of the changes in rubber properties at heat ageing 2
Study of the strength properties of unaged rubber at different temperatures 2
Study of the strength properties of aged at different temperatures rubbers 2
Conclusions (chapter 1) 9
Chapter 2. Life analysis of FS-seal and DB-seal 10
Results 11
Conclusions (chapter 2) 14
FE analysis of the FS-seal and DB-seal 15
Brief from theoretical basis of life estimation 18
Thermal dependence of elastic properties 18
Viscoelasticity at different temperatures 18
Life estimation 19
|
|
|
Life at uniaxial static tension 19
Life at complex static stressed state 20
Life of compressed cylinders 20
Strength properties of the rubber 23
Conclusions (brief basis) 25
References 26
(total 26 pages)
Abstract.
Life analysis of FS-seal and DB-seal. The goal of analysis was to estimate the life of CP seals at different temperatures (from 20C up to 150C) and pressures up to p = 70 MPa (10000 psi).
Standard properties of new and aged rubber considered in Chapter 1. Time of first cracks initiation considered in Chapter 2. Chapters 1 and 2 contains own but correlating conclusions. Brief theoretical basis explains the methodology used in Chapter 2.
Chapter 1. Prediction of the changes in rubber properties at heat ageing
Study of the strength properties of unaged rubber at different temperatures.
Notes:
1. References [1, 2, 4] recommend next properties for life estimation: tensile strength (tensile true stress), elongation at break (ultimate strain), stress relaxation, compression set, hardness, modulus. No common opinion about the most responsible property.
|
|
|
2. Presented results are for elastomer E50189 from [3]. Used for CP seals elastomer E50159 probably has better properties at high temperature.
3. All tests [3] were done in air or in nitrogen. Changes in properties at ageing in oil will differ.
The experimental results from[3] were used for properties extrapolation [2] at 150 C and prediction of changes at long life.
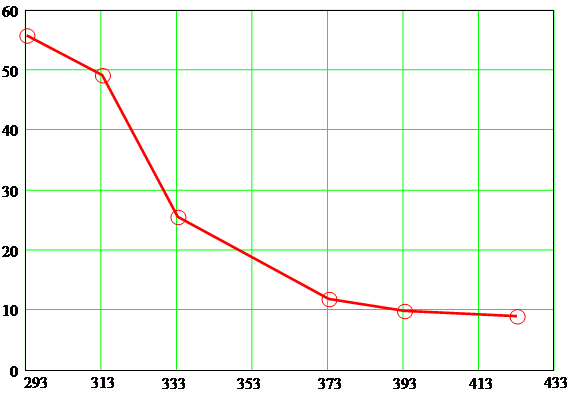
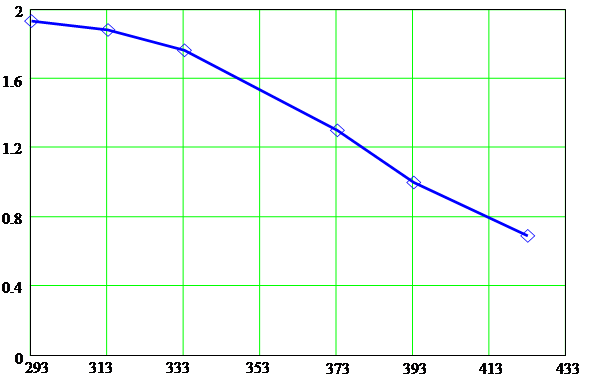
The standard dumbbells were loaded at constant deformation rate up to their fracture at temperatures from 293K (20C) to 433K (160C). Tensile stress σeng and ultimate strain ε f were measured. Tensile true stress was calculated next
σf = σeng (1 + ε f )
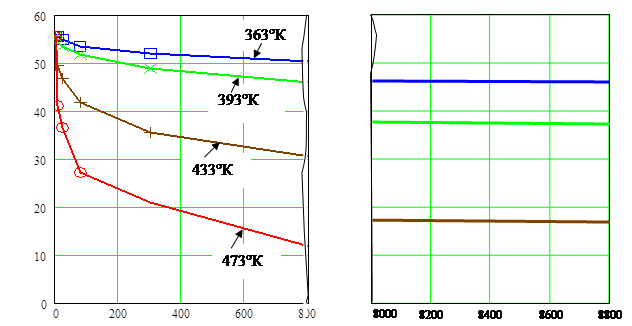
Results are illustrated in Fig. 1 and Fig. 2.
The circles are the mean statistical values (5 dumbbells normally was tensioned for each temperature); initial values at room temperature 20C are: σeng = 19 MPa, ε f = 1.93, σf = 55.6 MPa.
Study of the strength properties of aged at different temperatures rubbers.
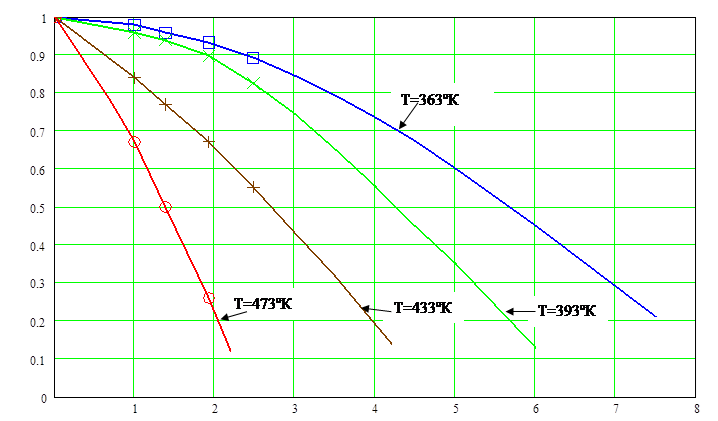
The dumbbells were aged at different constant temperatures in closed oven. Temperatures and times of aging were Т = 363, 393, 433 and 473К, t = 10, 24, 80 and 300 hours.
Time t in hours and temperature in K use in that chapter as recommended [2]
| t | t, hours | lg t |
| T˚K | T˚C |
| 1 hour | 1 | 0 | 363 | 90 | |
| 1 day | 24 | 1.38 | 393 | 120 | |
| 1 year | 8760 | 3.94 | 433 | 160 | |
| 10 years | 87600 | 4.94 | 473 | 200 |
Note: That is in Figures 3 – 8 value lgt = 4 is about one year of exposure and lgt = 5 is ten years.
Results are in tables 1 and 2.
Table 1
| T˚K | σf, MPa, after ageing during t, hours | ||||
| 0 (initial) | 10 | 24 | 80 | 300 | |
| 363 | 55.6 | 55.5 | 54.8 | 53.5 | 52.0 |
| 393 | 55.6 | 54.5 | 53.4 | 51.7 | 48.9 |
| 433 | 55.6 | 49.5 | 46.7 | 41.7 | 35.6 |
| 473 | 55.6 | 41.1 | 36.5 | 27.2 | - |
|
|
|
Table 2
| T˚K | ε f , after ageing during t, hours | ||||
| 0 (initial) | 10 | 24 | 80 | 300 | |
| 363 | 1.93 | 1.89 | 1.85 | 1.80 | 1.72 |
| 393 | 1.93 | 1.85 | 1.81 | 1.73 | 1.59 |
| 433 | 1.93 | 1.62 | 1.49 | 1.29 | 1.06 |
| 473 | 1.93 | 1.29 | 0.965 | 0.502 | - |
Results from tables are shown in Figures 3-5 for σfT / σf20 and in Figures 6-8 for ε fT / ε f20 . Where σf20 is the initial value at 20C.
Expression of the results was done in accordance with [2]:
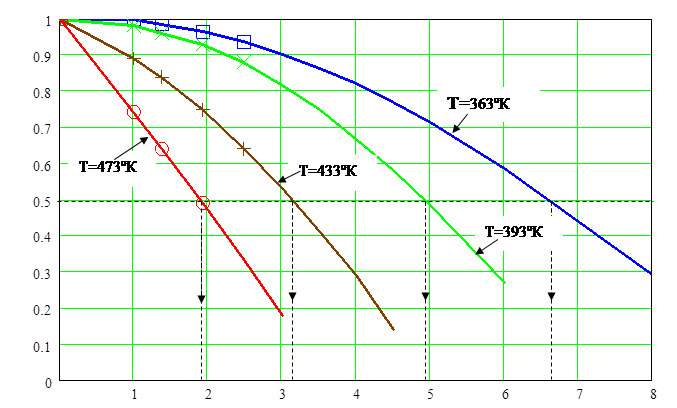
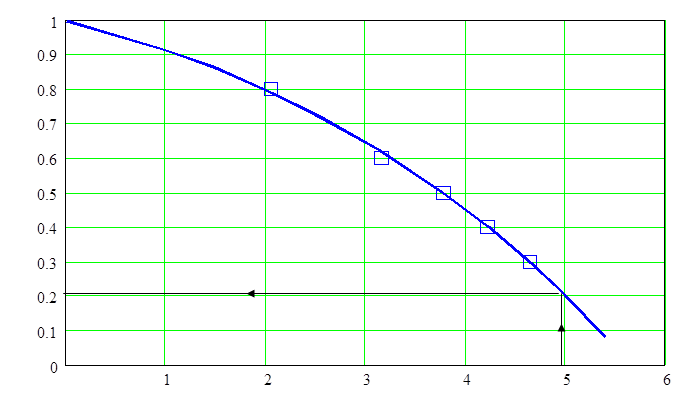
1. To facilitate the determination of the time at which the threshold value is reached, results were plotted to give a curve of property against time. Fig. 3.
As recommended in [1 - 7.2.2 “the following changes in properties are acceptable for elastomers: tensile strength, elongation – 50%”; 2 – 6 “A change to 50) of the initial value of the property under investigation is often used”] threshold 0.5 is shown in Fig. 3.
The values of times were determined by interpolation as shown in Fig. 3.
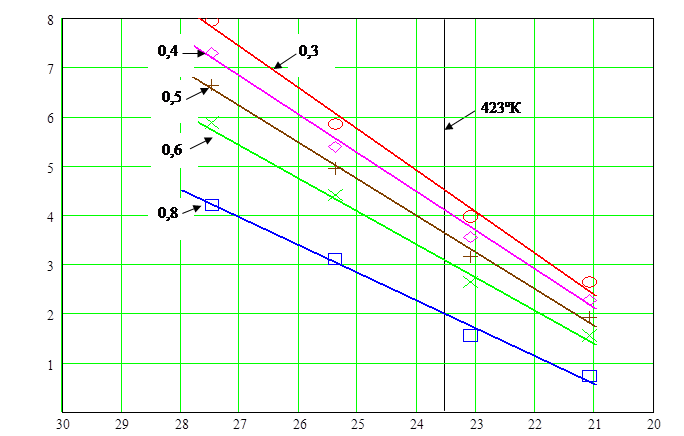
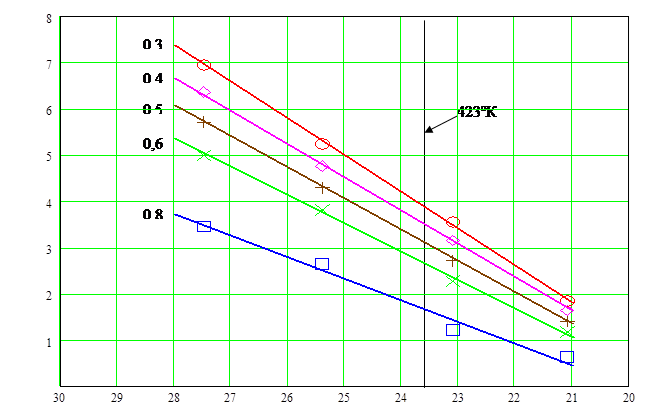
2. The log time at which the threshold value is reached for each of the temperatures against reciprocal 1/T of the corresponding temperature was plotted. Fig. 4.
The best-fit straight lines for different thresholds (0.3, 0.4, 0.5, 0.6, 0.8) were constructed by statistical methods.
Vertical line in Fig. 4 corresponds to 150C and helps to establish the correlation between the change in property and exposure time.
Fig. 4 is the typical Arrhenius plot – time of 0.5 (0.3, 0.4, 0.5, 0.6, 0.8) property retention versus reciprocal temperature.
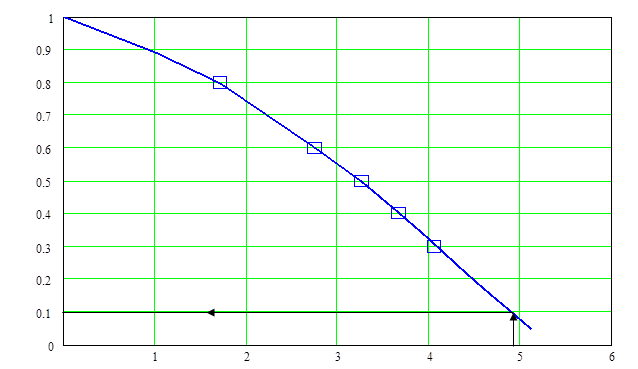
Fig. 5 was prepared for asked 150C. Value of 0.5 will be reached after one year of exposure; after ten years the value will be approximately 0.2.
The similar sequence and conclusions are from Figures 6 – 8.
The data from tables 1 and 2 were replotted similar to Figures 3 and 6 but in normal time. Figures 9 and 10 are for the information purposes only ([2] recommends to use log scale). Problems of extrapolation is known. There are many opponents to Arrhenius extrapolation, but [5] “Nevertheless, it is possible to use models such as Arrhenius o make meaningful predictive extrapolations”.
|
|
|
σf , MPa
 |
T , ˚К
Fig.1
ε f
 |
T, ˚К
Fig.2

lg t, hours  Fig.3
Fig.3
 lg t, hours
1 / T · 10 4
Fig.4

Lg t, hours
Fig.5

lg t, hours
Fig.6
 lg t, hours
1 / T · 10 4
Fig.7
lg t, hours
Fig.8
σf, MPa
 |
t, hours Fig.9
ε f
 |
t, hours Fig.10
Conclusions (chapter 1)
Conclusions are for times lgt = 4 (is about one year of exposure) and lgt = 5 (is ten years).
| Exposure at | Time > σfT / σf20 | Time > ε fT / ε f20 |
| Temperature 363K (90C) | 1 year > 0.8 10 years > 0.7 (Fig. 3) Acceptable | 1 year > 0.75 10 years > 0.6 (Fig. 6) Acceptable |
| Temperature 423K (150C) | 1 year > 0.45 10 years > 0.21 (Fig. 5) | 1 year > 0.3 10 years > 0.1 (Fig. 8) |
Workability and life of elastomer E 50189 can be guaranteed for exposure at temperatures up to 90C.
The life can be estimated from Figures 3-8 for each temperature of exposure or their combinations. The problem of exact value of threshold should be discussed. We believe the value of 0.1 (10% of elastic property retention) is acceptable for seal effect but may cause too small retrievability.
Chapter 2. Life analysis of FS-seal and DB-seal.
The goal of analysis was to estimate the life of CP seals at different temperatures (from 20C up to 150C) and pressures up to p = 70 MPa (10000 psi).
All dimensions are in mm, pressures and stresses are in MPa as in previous Reports.
Notes:
1. Life was estimated as the time of the first crack formation [3, 8].
2. Presented results are for elastomer E50189 from [3]. Used for CP seals elastomer E50159 probably has better properties at high temperature.
3. All tests [3] were done in air. Mentioned below properties (energy activation etc.) in oil may be differ.
Time t in seconds use in that chapter
| Life in normal units | Life in seconds |

|
| 1 minute 1 hour 1 day 1 month 1 year | 60


| 1.78 3.56 4.93 6.41 7.49 |
That is in Figures below the value lgt = 7.5 is about one year of exposure at constant pressure (8.5 is equal ten years etc.)
Results
Life of designed FS-seal and DB-seal is shown in Fig.1.1. Pressures are  MPa. Temperatures are
  °С.
°С.
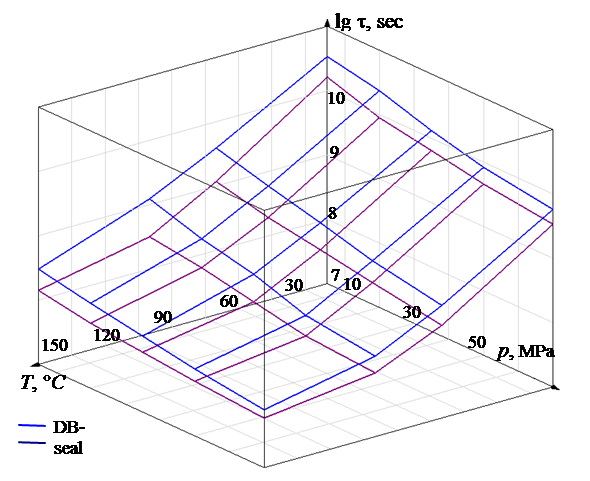 Fig.1.1
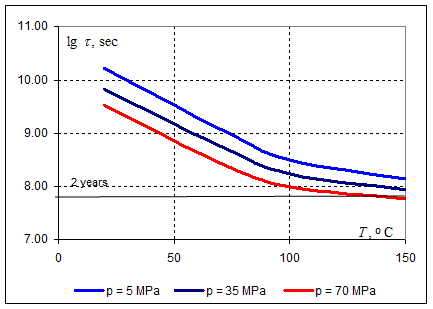
Fig.1.2
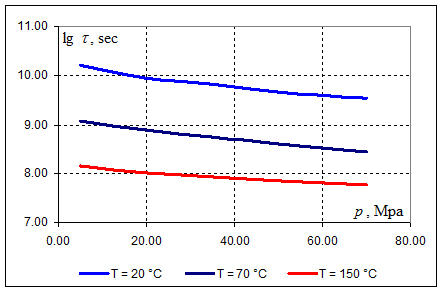
Fig.1.3
Dependence of life on T at different p is in Fig. 1.2 for FS-seal.
Dependence of life on p at different T is in Fig. 1.3 for FS-seal.
Dependence of life on T at different p is in Fig. 1.4 for DB-seal.
Dependence of life on p at different T is in Fig. 1.5 for DB-seal.
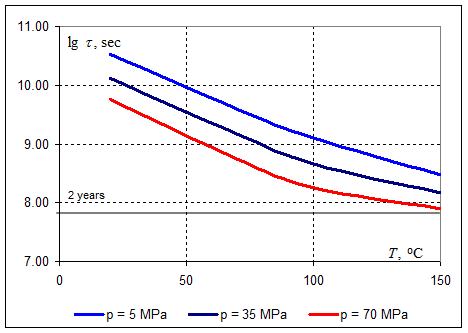
Fig.1.4
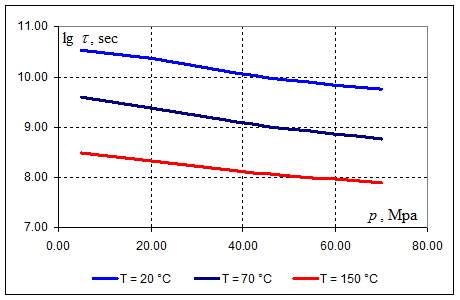
Fig.1.5
Minimal life was estimated at 150C and 70 MPa. For FS-seal time of the first crack formation is  (1.86 year). For DB-seal –
  (2.51 year).
Life at 70C and 35 MPa: FS-seal –  (18 years), DB-seal –
  (47 years). These values were presented in the first Report (dated 30 May 2004).
Life depends on temperature and practically doesn’t depend on pressure. Because designed seals belong to the class of well designed seals when  stresses are practically constant and depend on initial installation only; external pressure differential will add the hydrostatic component only.
First cracks will occur in point A (Fig.2.3) on ID surface in the center for both seals.
Conclusions (chapter 2)
Workability and life of seals made of elastomer E 50189 can be guaranteed for exposure at temperatures up to 80C and pressures up to 70MPa.
Minimal life was estimated at 150C and 70 MPa. For FS-seal time of the first crack formation is  (1.86 year). For DB-seal – (2.51 year). Life at 70C and 35 MPa: FS-seal – (18 years), DB-seal –
  (47 years).
Time of the crack growth can’t be estimated. We believe initial cracks on ID surface don’t reduce the seal effects but may cause too small retrievability.
Life can be estimated for different combinations of pressures and temperatures. If the 150C occurs periodically (say total less than one year) seals may be recommended.
Obviously recommended elastomer E50159 has better properties at elevated temperatures.
Дата добавления: 2019-09-13; просмотров: 188; Мы поможем в написании вашей работы! |

Мы поможем в написании ваших работ!