How to “build” a block checking a condition
Fig. 27 shows a block checking a condition. Such block is “built” as follows: you “drag”, one after another, the block IF-THEN (from the Control group), a logical expression (from the Operators group), and the sensor value (from the Sensing group) (Fig. 28).

Fig. 28. How to “build” a block checking a condition .
The numeric value can be changed in the Edit field.
Editing the script
If you need to remove a block from a ready script, the rule “Detach at the bottom” is used. As an example, to remove a block from the script in Fig. 29 (the block is marked by a red arrow), you have to:
1) “tear away” the piece of the script below the block that you want to remove, putting this piece aside;
2) “tear away” the said block in the same way;
3) bring back the former “torn away” piece and snap it to the bottom of the upper piece of the script.


Fig. 29. The way to remove a block from the script .
Projects To Make Use
of the ScratchDuino.Lab Components
Buttons
ScratchDuino.Lab allows you to operate virtual Actors. Consider using the buttons (resistance-A, resistance-B, resistance-C, and resistance-D variables).
Theme:“The Cat’s Journey”.
Requirements:
¾ for the “journey”, an appropriate picture is set as a background;
¾ on pressing the coloured buttons of ScratchDuino.Lab, the Cat must move rightwards, leftwards, upwards, and downwards;
¾ the script stops on pressing the space bar of the keyboard.
Implementation
Click on the Stage and select the Background tab. Select New background and click the Import button. A window with ready images will open. Select the Naturefolderand in this folder, select the file desert.
 |
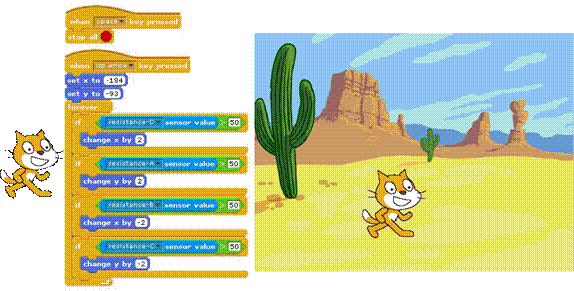
Fig. 30. Two sample scripts to control a sprite in a Cat costume (file cat1-a)
with the ScratchDuino.Lab keys. Framed is the first script that stops all scripts on pressing the space bar.
Slider
Theme: “Varying the Speed of the Ball by Slider”.
Requirements:
¾ the Actor is the Ball;
¾ launching the script, the Ball starts to move horizontally “back and forth”, bouncing from the walls within the Stage;
¾ the speed of the Ball is controlled with Slider;
¾ the script stops on pressing the space bar of the keyboard.
Implementation
The key idea of the solution is to change the coordinate step along the х axis. The effect of bouncing at the border of the Stage is implemented through a comparison of the current coordinate of the Ball (х position) and the coordinates of the left and right borders of the Stage: 200 and -200.
|
|
|


 |
Fig. 31. The script and the result of its performance.
Sound Sensor
Theme: “Hop on a Signal (a clap or a word uttered)”.
Requirements:
¾ the Actor is the Dancer;
¾ when the script is launched, you can see the Dancer ready to hop;
¾ on a loud shriek (or a clap of your hands), the Dancer hops and returns to initial position in 3 seconds;
¾ if the noise level in the room is greater than 24 all the way (for example, some music is playing), the Dancer still returns to initial position in 3 seconds (to have a rest) and then hops again;
¾ the script stops on pressing the space bar of the keyboard.
Implementation
Knowing the value at which the sound sensor reacts to a loud sound (a clap), you can choose the value to be put into the condition box. The solution is to change the costume of one sprite depending on the result of the check. Fig. 32 shows that on changing the sensor value (greater than 24) the costume is changed.


Fig. 32. The script and the result of its performance.
The effect of a hop is achieved by changing the center of the second costume (Fig. 33).


Fig. 33. Location of the new center for the costume ballerina-d.
Theme: “Show Your Magnitude!”
Requirements:
¾ two Actors are the Recorder and the Bat;
¾ the Recorder draws a red line which is the sound magnitude;
¾ the Bat hovers somewhere, “hears” the sounds, and “remembers” the maximal value of the Sound variable, displaying it in a cloud (Fig. 34);
¾ the value of the move is varied by the Slider;
¾ on pressing the space bar, all the scripts stop running, the picture disappears, and the Recorder is sent to initial position (bottom-left corner of the Stage).
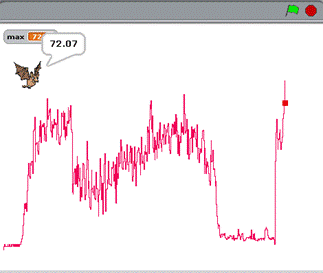
Fig. 34. The magnitude shown when the song Ohne dich (Rammstein) is played. The maximal magnitude is 72.
|
|
|
Implementation
Create two sprites (Fig. 35):
¾ on your own, make a red square which is the Recorder;
¾ take the Bat from the collection.

Fig. 35. Sprites for the project “Show Your Magnitude!”
As per our study of the sound sensor (see above), its minimal value at silence is 23. Therefore, you need to subtract this number so that the magnitude in the field would be zero. The sensitivity range is 23 to 93, that is, approximately 70 units, while the Stage to show the magnitude is 360-pixel high. Dividing 360 by 70, we obtain the multiplier for the magnitude to fit into the Stage. “-150” is the value of the step to move the picture downwards along the y axis, as the coordinate center of the sprite (a point of (0;0) coordinates) is in the middle of the Stage. The Slider’s range is 0 to 100. Dividing by 200 allows to vary the step from 0 to 0.5.


Fig. 36. Two scripts for Sprite 1: one “draws”, while the other, if the space bar is pressed, “erases” the picture and sets the Self-Recorder to the initial position.
The Bat’s task requires to use a variable max[4]. Before the loop, it is set to 0. If within the loop the sound sensor value exceeds zero, the value of variable max is updated and displayed in the cloud for 1 second.

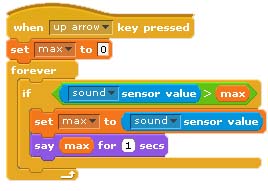
Fig. 37. Script for Sprite 2.
External Temperature Sensor
Theme: “Household Thermometer”.
Requirements:
¾ Two Actors are the Scale and the Red Arrow;
¾ the Scale of the household thermometer is placed on the left;
¾ the Red Arrow moves along the Scale, while on the left a numeric value of the temperature is displayed in an output window (Fig. 39);
¾ you have to determine the size of one degree in pixels at the Scale.
¾ on pressing the space bar, all the scripts stop running, and the Scale is sent to initial position (bottom-left corner of the Stage).
Implementation
On your own, make both sprites: the temperature Scale ranging 0 to +50 and the Red Arrow (Fig. 38).

Fig. 38. Sprites for the project.
|
|
|


Fig. 39. Three views of the screen, showing the results of the project .
You can see a dynamic change of the measured temperature of the ambience.
We are going to make two scripts for Sprite 2 (Scale): a standard stop on pressing the space bar, while on launching the project (on pressing the “up arrow” key) the Scale is placed in the bottom-left corner of the Stage (Fig. 40).


Fig. 40. Script for the sprite Scale.
Explanations on the formula for the Red Arrow.
1. Express one degree of the scale in pixels. For that, measure the scale in pixels and divide this value by 50. Set the mouse pointer at a zero value of the Scale (the bottom-left corner). Notice the numeric value at the Info Panel. In our case, it is “– 175”. On pointing at the maximal value of the Scale, notice the coordinate 175. Therefore, the value of a move by one degree can be calculated by the formula (175+175)/50=7. It is the scale interval in pixels to set Red Arrow coordinates in Fig. 39.
2. For the dependency of the sensor meterage on the thermometer readings, use Formula 2 derived before: х = 2,2237у + 0,9261. Apply these coefficients to set the Red Arrow coordinates (Fig. 41).


Fig. 41. Script for the sprite Red Arrow.
Note: The sensor was calibrated by a household thermometer, which is never too exacting. That’s why during the project implementation it was noticed that the sensor showed the temperature value higher than our own senses suggested. You have to calibrate your temperature sensor using a thermometer of a better precision.
External sensors
Theme: “The Voltmeter To Measure the Voltage Drop at Direct Electric Current, within the Range of 4–20V”.
Re q uirements:
¾ made the Voltage Divisor of three resistors of 91KΩ each (Figs. 42 and 43);
¾ calibrate the Voltage Divisor using a digital voltmeter;
¾ use two actors in the script: the Voltmeter Scale and the Red Arrow;
¾ the Voltmeter Scale is placed on the left;
¾ the Red Arrow moves along the Voltmeter Scale;
|
|
|
¾ the measured numerical value of the voltage is shown in the variable output window (Fig. 42);
¾ on pressing the space bar, all the scripts stop running.
Implementation


Fig. 42. Measuring the battery voltage
using the Device, and a view of the screen.
ScratchDuino.Lab kit includes a connecting cable with three crocodile clips. The black clip is for “minus”, the red one is for “analog input”, while the yellow one is powering the sensor (4.36V). You can check it with a voltmeter.
Use the black and the red clips. For a voltage range of 4–20V, make a “Voltage Divisor”. The resistance of a voltmeter must be sufficiently high. To avoid complicated calculations and determining the internal resistance of the analog input, calibrate the device by experiments. Take three resistors of a 91KΩ each. Fig. 43 shows that the voltage drop is actually measured on a resistor. Calibrate the Voltage Divisor.

Fig. 43. The Voltage Divisor
made of three resistors of a 91KΩ
and crocodile clips.
Table 4. Relation between the Values of the ScratchDuino.Lab Sensor
and the Digital Voltmeter
| The voltage applied to the device measured by the digital voltmeter | Sensor value | Coefficient |
| 3.94 | 18.57 | 4.71 |
| 4.95 | 23.4 | 4.73 |
| 5.9 | 28 | 4.75 |
| 6.97 | 33 | 4.73 |
| 8.03 | 38.03 | 4.74 |
| 9 | 42.72 | 4.75 |
| 10.02 | 47.51 | 4.74 |
| 11.08 | 52.49 | 4.74 |
| 12 | 56.9 | 4.74 |
| 13.02 | 61.68 | 4.74 |
| 14.03 | 66.57 | 4.74 |
| 15.77 | 74.7 | 4.74 |
| AVERAGE | 4.74 |
As Table 4 shows, the dependency is linear. The average coefficient is 4.74.
On your own, make two sprites: the Voltmeter Scale ranging from 0 to 20V and the Red Arrow (Fig. 44).

Fig. 44. Sprites for the project.
Make the script for the Voltmeter Scale, so that on launching the project (on pressing the “up arrow” key) the Voltmeter Scale is placed in the bottom-left corner of the Stage (Fig. 45).


Fig. 45. Script for the sprite Scale.
Explanations on the formula in the script for the spriteRed Arrow:
¾ place the Arrow closer to the Scale picture;
¾ use variable u for the measured voltage;
¾ place the Arrow at the y axis according to the variable value;
¾ show the variable.

Fig. 46. Script for the sprite Red Arrow.
Test the Voltage Divisor. Measure the battery voltage as shown in Fig. 42. The dynamic changes of the value will be displayed.
Note: Using this device, you can measure a voltage of 0 to 4V. However, your meterage is not going to be very precise. At the same time, measuring a voltage of 0 to 4V is not difficult, as no divisor is needed: it is enough to connect a power source of up to 4V to the black and the red clips. It is important to make the calibration following the above-mentioned methods and make a separate script.
Дата добавления: 2019-01-14; просмотров: 266; Мы поможем в написании вашей работы! |

Мы поможем в написании ваших работ!