Description of the Students’ Questionnaire
The questionnaire is composed of 13 questions in which the majority of the questions are closed. We use these kinds of questions in order to make them easy to answer by all students, this questionnaire is composed of three sections. The first section includes only one personal question which aimed to specify the participants gender and to check whether the gender could make a difference in this type of phobia or no. The second section is about Phobia in the Exam, and it includes (03) questions which aimed to clarify whether the students have this kind phobia or if they suffer from any other symptoms during the examination. Lastly, the third section consists of 11 questions which devote to examine the factors that cause phobia for learners.
Administration of the Students’ Questionnaire
The questionnaire was administered to 25 students of 1st year from 673 of the total number of students who study English language at Biskra university, in which they were chosen randomly. The students answered the questionnaire in their classroom with the presence of their teacher.
Discussion and Analysis of Student’s questionnaire
After collecting data from students’ answers, we will analyze the results. The current analysis could help us to understand and find the source of the problem.
Section one: Personal information
Item 01. Are your male female
| Gender | Frequency | Percentage |
| Male | 11 | 44% |
| Female | 14 | 56% |
| Total | 25 | 100% |
Table3.1: Students’ Gender distribution
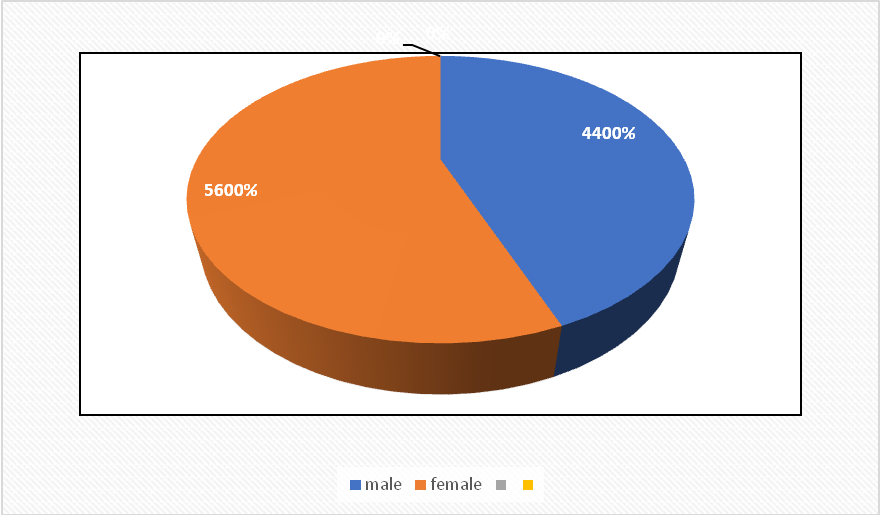
Graph 3.1: Student’s Gender distribution
Table 1 shows that the number of females is 14(56%) and the number of males is 11(44%). This reflects that our study consists of both males and females; However, the number of female learners is more than the number of male learners. The obtained information from this table might have some effects on the results of the study. It can help us in discovering whether exam phobia exists among one gender or among both of them.
Section two: Phobia in the exam
Item 02.Have you ever faced a certain fear in your examinations?
| Options | Frequency | Percentage |
| Always | 7 | 28% |
| Usually | 5 | 20% |
| Sometimes | 11 | 44% |
| Never | 2 | 08% |
| Total | 25 | 100% |
Table 3.2: Frequency of Students’who faced a certainFear During the Examination
|
|
|
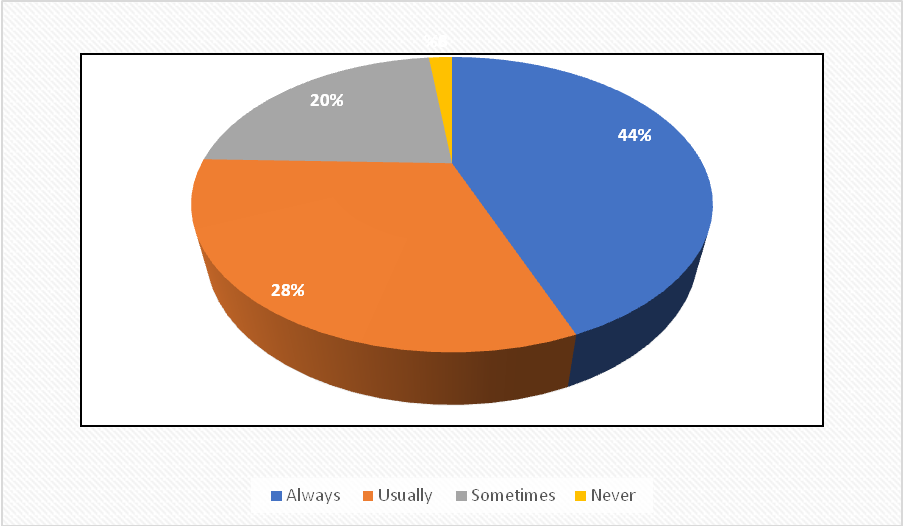
Graph 3.2: Students’ Fear During the Exam
The table (02) and the chart (02), above give us an idea about the students’ possibility of facing a fear in an examination. (07%) of the respondents claimed that they always face a fear in the examinations. (05%) of them said that they usually face a fear in the examination. (11%) of the respondents claimed that they sometimes face a fear in the examination, and they represent the majority of their respondents. The last options clarify that (03%) of the respondents they never face a fear in examination.
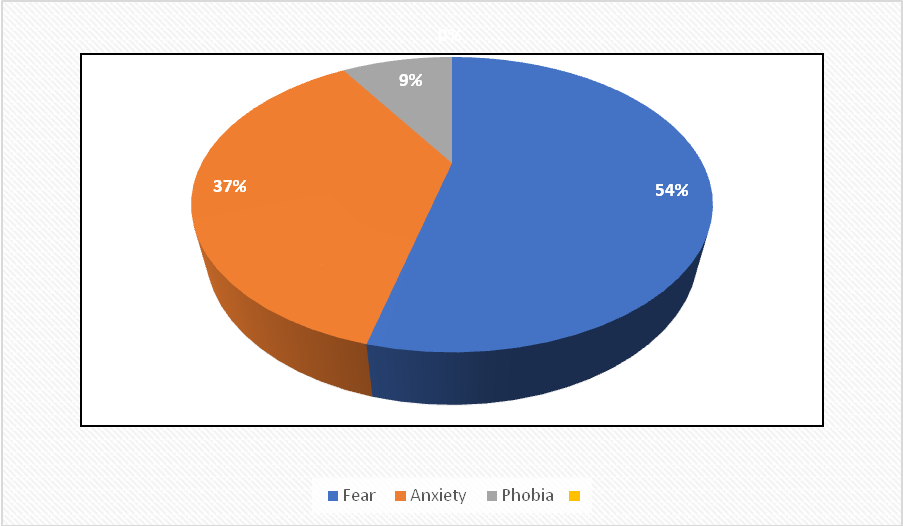
Item 03. To what extent do you evaluate your fear?
| Options | Frequency | Percentage |
| Fear | 06 | 54% |
| Anxiety | 04 | 37% |
| Phobia | 01 | 09% |
| Total | 25 | 100% |
Table 3.3-a: Student’s Classification of Fear
Дата добавления: 2018-08-06; просмотров: 367; Мы поможем в написании вашей работы! |

Мы поможем в написании ваших работ!