Figure 5 Import and Export Growth and the Trade Surplus
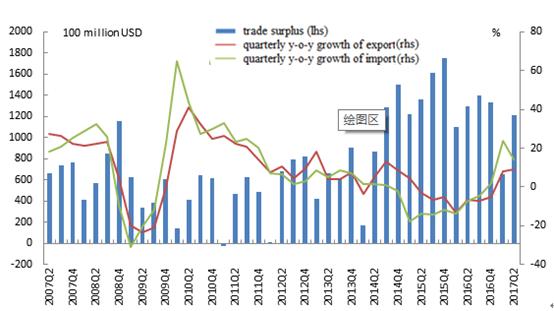
Source: General Administration of Customs
Agricultural production was generally stable and industrial production picked up notably
In terms of industries, the value-added of tertiary industry grew faster than that of secondary industry, though the share of secondary industry picked up. In the first half of 2017, the value-added of the primary, secondary, and tertiary industries were RMB 2.2trillion, RMB 15.3 trillion, and RMB 20.7 trillion respectively, up 3.5 percent, 6.4 percent, and 7.7 percent year on year and accounting for 5.8 percent, 40.1 percent, and 54.1 percent of GDP. The share of tertiary industrywas 14 percentage points higher than that of secondary industry, though the share of secondary industry increased by 1.4 percentage points compared with Q1.
Agricultural production was generally stable. Summer grain crops rose by 0.9 percent year on year to 140.52 million tons, a 1.31 million ton increase from 2016. During the first half of 2017, total output of pork, beef, mutton,and poultry increased by 1 percent year on year to 38.92 million tons, 0.8 percentage point higher than that in Q1.
Industrial production accelerated and corporate profits continued to improve. During the first half of 2017, the value-added of statistically large industrial firms (SLIFs) increased by 6.9 percent year on year in comparable prices, 0.1 percentage point higher than that in Q1. The manufacturing industry was upgrading to the mid- and high-end. In the first half of 2017, growth of value-added in the high-tech and equipment manufacturing industries outperformed the SLIFs by 6.2 percentage points and 4.6 percentage points respectively, accounting for 12.2 percent and 32.3 percent of the total value-added of SLIFs respectively. Corporate profits continued to improve. During the first half of 2017, the profits of SLIFs surged 22 percent year on year to RMB 3633.75 billion, with year-on-year growth in June registering 19.1 percent, 2.4 percentage points higher than thosein May. Profit margins of key businesses stood at 6.35 percent, 0.29 percentage point higher than those in the last year and maintaining an upward trend. According to theQ2 Entrepreneurs’ Surveyof 5,000 Industrial Enterprises, conducted by the PBC, the corporate performance index posted 54.6 percent, up by1.9 percentage pointsover the last quarter andexceeding 50 percent for the fourth consecutive quarter. The corporate profit index reached 56.1 percent, up by 6.2 and 3.4 percentage points hq/q and y/y respectively.The domestic order index posted 50.6 percent and the export order index posted 50.4 percent, both exceeding 50 percent for the first time since Q4 of 2011.
Consumer prices rose moderately and the growth of producer prices declined
Consumer prices rose moderately. During the first half of 2017, the CPI rose 1.4 percent year on year. Monthly growth from April through June registered 1.2 percent, 1.5 percent, and 1.5 percent respectively, with an average of 1.4 percent in Q2, the same as that in Q1. In terms of food and non-food items, food prices dipped further and the growth of non-food prices remained stable. In Q2, the price of food declined by 2.1 percent year on year, 0.1 percentage point greater than that in Q1. The price of non-food items climbed 2.3 percent year on year, the same as that in the previous quarter. In terms of consumer goods and services, growth in the priceof consumer goods declined slightly, while growth in the price of services accelerated. The price of consumer goods rose 0.5 percent year on year, 0.2 percentage points less than that in the last quarter. The price index for services was up 2.9 percent year on year, 0.1 percentage point higher than that in the last quarter.
The growth of producer prices slowed down. During the first half of 2017, the PPI gained 6.6 percent year on year, 1.6 percentage points lower than that in the last quarter. Monthly growth from April through June stood at 6.4 percent, 5.5 percent, and 5.5 percent respectively, averaging 5.8 percent in Q2 and down 1.6 percent from the last quarter. In terms of consumer goods and capital goods, the growth of capital goods slowed down significantly, whereas the growth of consumer goods slowed down slightly. In Q2,the price of capital goods rose 7.7 percent year on year, 2.2 percentage points lower than that in Q1. The price of consumer goods climbed 0.6 percent, which was 0.2 percentage point lower than that in Q1. The Purchasing Price Index for Industrial Products (PPIIP) gained 8.7 percent year on year, with monthly growth from April through Juneat9.0 percent, 8.0 percent, and 7.3 percent respectively, an average of 8.1 percent which was 1.3 percentage points lower than that in Q1. In Q2, the price of agricultural products declined by 6.4 percent year on year, 4.2 percentage points lower than that in the last quarter. The price of agricultural capital goods rose 0.1 percent year on year, 1.1 percentage points less than that in the previous quarter. In the first half of 2017, the Capital Goods Price Index (CGPI), compiled by the PBC, rose by 7.6 percent year on year, with a more rapid price recovery in primary goods, at 8.5 percent growth year on year. The price of investment goods climbed by 6.8 percent whereas the price of consumer goods declined by 0.03 percent year on year.
The price of global commodities moved generally downward and the growth of import prices slowed down. In Q2, the average price of ICE Brent oil futures rose by 8.0 percent year on year, but it dropped by 6.9 percent quarter on quarter. On the London Metal Exchange, the average price of spot copper surged 19.7 percent year on year, but it dropped 2.9 percent quarter on quarter. Spot aluminum soared by 17.3 percent year on year, but it dropped 0.3 percent quarter on quarter. During the first half of 2017, import and export prices went up by 12.6 percent and 5.5 percent respectively. Monthly year-on-year growth of import prices from April through June stood at 13.5 percent, 12.4 percent, and 9.5 percent respectively, an average of 11.8 percent, which was 1.6 percentage points lower than that in the last quarter. Monthly year-on-year growth of export prices registered 6.9 percent, 5.4 percent, and 5.1 percent respectively, an average of 5.8 percent and up by 0.7 percentage point over the last quarter.
Growth of the GDP deflator narrowed. During the first half of 2017, the GDP deflator (the ratio of GDP in current prices to GDP in constant prices) was up by 4.3 percent year on year. The GDP deflator in Q2 posted growth of 3.9 percent,0.7 percentage point lower than that in Q1.
The price reforms continued steadily. On June 6, government agencies, including the NDRC, issued a notice on promoting comprehensive water price reform foragricultural production, which stipulated that all provinces(autonomous regions and municipalities) should conduct a comprehensive waterprice reform foragricultural production where conditions permit so as to provide models for other regions. The reformaims to coordinate the mechanisms of water price formation, subsidies and water conservation incentives, project construction and maintenance, as well water management so as to establish and improve the institutional arrangement for water conservation without increasing the burden on farmers.
Дата добавления: 2018-02-28; просмотров: 316; Мы поможем в написании вашей работы! |

Мы поможем в написании ваших работ!