Frequency characteristics of simplest circuits.
Frequency characteristics of first-order circuits
Consider the simplest rC-circuit (Fig.5.5.a).Let us define the complex voltage transfer ratio:
 (5.26)
Fig.5.5
Пропущены формулы и текст и рисунки (со стр. 130 )
Fig.5.6
Fig.5.7
If τ is denoted as time constant: τ = l/r, than
 (5.27)
The expression (5.84) coincides with (5.71) for the rC-circuit in Fig.5.5.a. Consequently, the frequency characteristics of the circuits in Fig.5.8.a and 5.5.a are identical.
The analysis shows that the frequency characteristics on the circuits in Fig.5.8.b and 5.5.b are also identical.
5.3.2. Frequency characteristics of second- and third-order circuits
Consider the second-order circuit in Fig.5.9.The matrix of node conductances for this circuit is as follows:
 (5.28)
Fig. 5.8 Fig.5.9
Hence, the algebraic adjuncts D13 and D11 are:
Пропущена формула
Here M13 and M11 are the minor-determinants obtained from the matrix determinant (5.28) by deleting the first line and third column and the first line and first column, respectively, that is
Пропущена формула
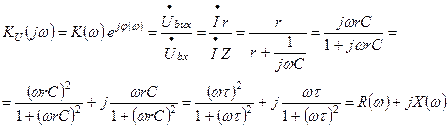
The voltage transfer ratio in (5.53) is:

(5.29)
Here
 (5.30)
 (5.31)
where τ = rC is a time constant.
The diagrams of AFC and APFC are given in Fig.5.10.a and Fig. 5.10.b respectively.
Fig. 5.10
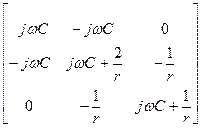
Consider the second-order circuit in Fig. 5.11 (the Wien bridge).The matrix of node conductances for the circuit is as follows:
|
|
|
Пропущена формула
Fig.5.11 Fig. 5.12
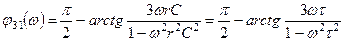
Hence, the algebraic adjuncts D12 and D11 are:
Пропущены формулы
The voltage transfer ratio in will be
 (5.32)
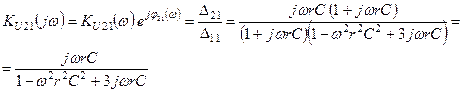
Here
 (5.33)
 (5.34)
When comparing (5.33) and (5.34)with (5.30), (5.31), we see that these expressions are identical and, consequently, the circuit frequency characteristics in Fig.5.9 and 5.11 coincide
Consider the third-order circuit in Fig. 5.2 (double T-form bridge).
The matrix of node conductances for this circuit is as follows:
Пропущена формула
Hence, the algebraic adjuncts D14, D11 are:
Пропущеныформулы
The voltage transfer ratio equals
пропущена формула
Here
Пропущена формула
Phase angle equal
The diagrams of AFC and APHFC are represented in Fig. 5.13.a and Fig. 5.13.b.
Fig.5.13
Дата добавления: 2021-03-18; просмотров: 49; Мы поможем в написании вашей работы! |

Мы поможем в написании ваших работ!