Transactions: the circular-flow diagram
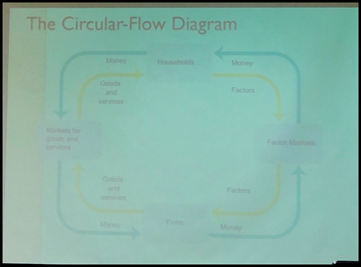 |
The circular-flow diagram is a model that represents the transactions in an economy by flows around the circle
Ultimately, factor markets determine the economy’s income distribution, how total income is divided among the owners of the various factors of productions
Using models
Positive economics is the branch of economic analysis that describes the way the economy actually works
Normative economics makes prescriptions about the way the economy should work
A forecast is a simple prediction of the future
Supply and demand
The supply and demand model is a model of how a competitive market works.
Five key elements:
· demand curve
· supply curve
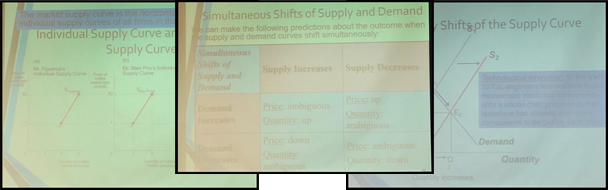
· demand and supply curve shifts
· market equilibrium
· changes in the market equilibrium
A demand schedule shows how much of a good or service customers will want to buy at different prices.
A demand curve - the graphical representation of the demand schedule. It shows how much of a good or a service consumers want to buy at any given price.
Increase in demand is a rise in the quantity demanded at any given price.
A shift of the demand curve is a change in the quantity demanded at any given price, represented by the change of the original demand curve to a new position, illustrated by a new demand curve.
⁃ Increase in demand - rightward shift
⁃ Decrease in demand - leftward shift
Related goods:
Substitutes: a fall in the price of one of the goods makes consumers less willing to buy the other good
Complements: a fall in the price of one good makes people more willing to buy the other good.
Types of goods: (changing in income)
⁃ Normal goods: a rise in income increases the demand for a good
⁃ Inferior goods: a rise in income decreases the demand for a good
Change in taste
Change in expectations
The market demand is the horizontal sum of the individual demand curves of all consumers in the market
A supply curve shows graphically how much of a good or service people are willing to sell at any given price.
A shift of a supply curve is a change in the quantity supplied of a good that is the result of a change in the good’s price.
Increase - shift to the right
Decrease - shifts to the left
Market Equilibrium (E)
Is a situation in which quantity demanded of a good equals the quantity supplied of that good.
The price at which this takes place is the equilibrium price (a.k.a market-clearing price)
|
|
|
Surpluswhen quantity supplied exceeds quantity demanded. Surpluses occur when the price is above its equilibrium level.
Shortage of good happens when quantity demanded exceeds the quantity supplied.
Revenue - доход компаний (грязный)
Consumer and Producer Surplus
Individual consumer surplusis the net gain to an individual buyer from the purchase of a good. It is equal to the difference between the buyer’s willingness to pay and the price paid.
Total consumer surplusis the sum of the individual consumer surpluses of all the buyers of a good in a market.
The term consumer surplusis often used to refer to both individual and to total consumer surplus.
A seller’s costis the lowest price at which he or she is willing to sell a good.
Individual producer surplusis the net gain to an individual seller from selling a good. It is equal to the difference between the price received and the seller’s cost.
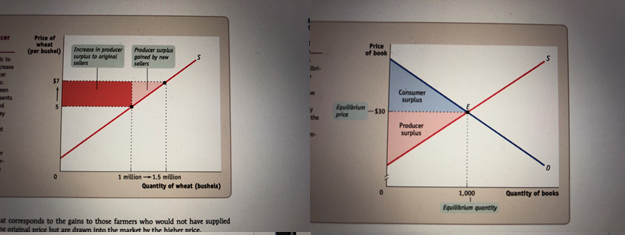
Total producer surplusin a market is the sum of the individual producer surpluses of all the sellers of a good in a market. Economists use the term producer surplusto refer both to individual and to total producer surplus.
The demand curve for good is determined by each potential consumer’s willingness to pay.
When the price of a good rises, producer surplus increases through two channels: the gains of those who would have supplied the good at the original price and the gains of those who are induced to supply the good by the higher price. A fall in the price of a good similarly leads to a fall in producer surplus.
The total surplusgenerated in a market is the total net gain to consumers and producers from trading in the market. It is the sum of the producer and the consumer surplus.
Total surplus measures the gains from trade in a market.
Markets are efficient except under some well-defined conditions. We can demonstrate the efficiency of a market by considering what hap- pens to total surplus if we start from the equilibrium and reallocate consumption, reallocate sales, or change the quantity traded. Any outcome other than the market equilibrium reduces total surplus, which means that the market equilibrium is efficient.
|
|
|
Because society cares about equity, government intervention in a mar- ket that reduces efficiency while increasing equity can be justified.
Property rightsare the rights of owners of valuable items, whether resources or goods, to dispose of those items as they choose.
An economic signal is any piece of information that helps people make better economic decisions.
A market or an economy is inefficientif there are missed opportunities: some people could be made better off without making other people worse off.
Market failure occurs when a market fails to be efficient.
In a market economy, market share interrelated. When each and every market in an economy is efficient, the economy as a whole is efficient. But in the real world, some markets in a market economy will almost certainly fail to be efficient.
A system of property right sand the operation of prices as economic signalsare two key factors that enable a market to be efficient. But under conditions in which property rights are incomplete or prices give inaccurate economic signals, markets can fail.
Under certain conditions, market failure occurs and the market is inefficient: gains to trade are unrealized. The three principal ways in which markets fail are the prevention of mutually beneficial transactions caused by one party’s attempt to capture more surplus, side effects that aren’t properly account- ed for, and problems in the nature of the goods themselves.
Elasticity
The price elasticity of demandis the ratio of the percent change in the quantity demanded to the percent change in the price as we move along the demand curve (dropping the minus sign).
The midpoint methodis a technique for calculating the percent change. In this approach, we calculate changes in a variable compared with the average, or midpoint, of the starting and final values.
Demand is perfectly inelastic when the quantity demanded does not respond at all to changes in the price. When demand is perfectly inelastic, the demand curve is a vertical line.
Demand is perfectly elasticwhen any price increase will cause the quantity demanded to drop to zero. When demand is perfectly elastic, the demand curve is a horizontal line.
|
|
|
Demand is elasticif the price elasticity of demand is greater than 1, inelasticif the price elasticity of demand is less than 1, and unit-elasticif the price elasticity of demand is exactly 1.
The total revenueis the total value of sales of a good or service. It is equal to the price multiplied by the quantity sold.
The cross-price elasticity of demandbetween two goods measures the effect of the change in one good’s price on the quantity demanded of the other good. It is equal to the percent change in the quantity demanded of one good divided by the percent change in the other good’s price.
The income elasticity of demandis the percent change in the quantity of a good demanded when a consumer’s income changes divided by the percent change in the consumer’s income.
The price elasticity of supplyis a measure of the responsiveness of the quantity of a good supplied to the price of that good. It is the ratio of the percent change in the quantity supplied to the percent change in the price as we move along the supply curve.
There is perfectly inelastic supply when the price elasticity of supply is zero, so that changes in the price of the good have no effect on the quantity supplied. A perfectly inelastic supply curve is a vertical line.
There is perfectly elastic supplywhen even a tiny increase or reduction in the price will lead to very large changes in the quantity supplied, so that the price elasticity of supply is infinite. A perfectly elastic supply curve is a horizontal line.
Дата добавления: 2021-01-20; просмотров: 55; Мы поможем в написании вашей работы! |

Мы поможем в написании ваших работ!