PRECAST PRODUCTION AND TRANSPORTATION PLANNING MODEL
Programming in precast production and transportation planning
Tom Nescu
1 Canadian University of Technology / Engineering Department, Ontario, Canada
ABSTRACT
The optimization of transport connections is a commonly occurring decisional problem in construction. With increasingly complex projects and construction contracts involving the supply of various precast units to construction sites from many production plants, the optimization of both transport and production becomes an additional decision problem. In addition, with limited production capacities of manufacturing plants and diversified construction sites temporary demand for the products, proper planning of production and supply strategies seems to be complicated. The purpose of this optimization is to minimize the costs associated with the production and delivery of precast elements to construction sites. It is necessary to develop a model supporting managerial decision-making in the field of planning production and transport strategies. The objective of this study is to enhance decision-making process by developing precast production and transportation planning model (PPTPM) based on nonlinear programming. The performance of the proposed model is validated by a case study. The results show that the PPTPM can successfully search for optimized production and delivery programmes.
INTRODUCTION
Precast concrete manufacturing plants have demonstrated high production efficiency in the recent years. Due to the implementation of automation, reduction of waste, accurate planning, and resource utilization the precast concrete industry has the positive impact on the construction. A continuous need for prefabrication around the world is still observed, but the need is ever changing with the time and new technologies. In order to utilize construction schedule, cost, workforce safety and quality, Design for Manufacturing and Assembly (DfMA) have been introduced. DfMA techniques influence positively also on the time and cost savings reported as 66% and 65% in American projects [1]. Moreover, as buildings are taller, larger, and more complex, it has become increasingly more difficult to secure stockyards for materials and to resolve the surrounding traffic problems, creating an increased need for Just-In-Time (JIT) delivery [2]. Obviously, in order to implement Just-In-Time methodology to the delivery of precast elements, a proper production planning need to be considered. It consists of master production scheduling, material requirement planning and shop floor scheduling [3]. As the scheduling problems have become more complicated and the optimized solution cannot be achieved within a reasonable time, the studies on scheduling have shifted to applying heuristic algorithms [4]. Regarding the material requirement planning a monitoring system material delivery for the construction of cable-stayed bridges in which RFID and CCTV technologies were utilized to accurately identify the deck segments [5]. Additionally, delivering a great variety of precast elements to a large number of construction sites requires information integration, especially between production and other processes. Over the last 15 years several research were carried out in this field, including for example: a multi-level data model for piping systems and to enhance the workflow, productivity and quality of the projects [6], testing the exchange capabilities of BIM data between existing architectural BIM software and fabrication-level precast BIM software [7]. Although BIM and RFID enriched Enterprise Resource Planning (ERP) some pragmatic problems still remain unsolved. For example, the mixed production situation, where the production for several projects is carried out in the same plant or even same production line simultaneously, is neglected [8]. Research needs in this area include, among others, the development of holistic models enabling the planning of the production and supply of precast elements for a large number of projects implemented simultaneously with cost-time optimization. The use of heuristic algorithms enables obtaining near-optimal solutions in complex issues production scheduling and supply. However, it often happens that the issues of production and supply optimization in construction are not so highly complex and thus do not require the use of heuristic algorithms. Instead, it is expected to obtain accurate solutions, which makes the application of non-linear optimization methods reasonable.
|
|
|
PRECAST PRODUCTION PROCESSES
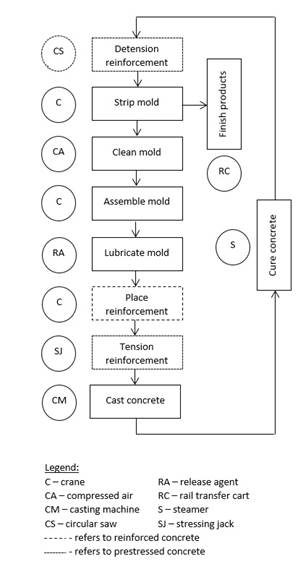
Current global construction market offers a wide range of precast elements including, for example, floor and roof beams, railway slippers, slabs, poles, walls and many other elements [9]. Depending on the intended use and the requires strength, precast elements can be planned and manufactured as concrete without reinforcement, reinforced concrete, prestressed concrete and post-tensioned concrete. Precast concrete production can be divided into seven steps: (1) mold assembly, (2) mold lubrication, (3) concrete casting, (4) curing, (5) mold stripping, (6) product finishing, and (7) mold cleaning. In case of reinforced concrete the production is extended into eight steps, and in case of prestressed concrete into ten steps (Fig. 1). In terms of production organization, precast production can be divided into two categories according to the difference in production methods, namely flowshop production and fixed location production [3]. In the flowshop production each step is handled in a particular workstation by a particular team. For the fixed location production, the division of precast production is similar, while all steps of a component are handled in a fixed workstation by the same or different teams. Generally speaking, the production capacity and resource utilization rate of the fixed location production is lower than that of the flowshop production [3]. To enhance the chemistry-solidifying concrete, steam curing is implemented [10]. Otherwise, the component concrete requires about 28 days to reach its legal strength. One of the first decision to be made in the precast production process is the number of molds. Due to the high cost of steel molds, the difficulty in shifting, and the great variety of elements, one single mold is incapable of manufacturing all types of elements. Therefore, to effectively reduce the cost, fabricators usually manufacture all construction elements via a limited number of molds [4]. Not without significance is the selection of the mold type. In order to meet the requirements of the market, the concrete manufacturers need to reconcile flexibility, productivity, and safety, while offering an ever-larger of high-quality products. Mold changeover operation has a significant meaning for productivity and safety in the precast manufacturing plant [11].
|
|
|
|
|
|
Figure 1. Precast production process for reinforced and prestressed concrete.
In addition, the production sequence is also a critical factor related to makespan. A well-planned sequence is helpful in utilizing resources more efficiently and reducing idle time during the production process [4].
PRECAST PRODUCTION AND TRANSPORTATION PLANNING MODEL
General description
Four precast production plants (m = 1, 2, 3, 4), with a total weekly production capacity of 990 tons, supply four construction sites (n = 1, 2, 3, 4) with precast elements with a combined weekly demand of 980 tons. The quantity of the product produced in the factory m and transported to the construction site n is described as xmn, with the assumption that the variable cannot have the value lower than zero xmn ≥ 0. Detailed data are presented below in Table 1.
Table 1. Input data.
|
Precast production plant | 1 | 2 | 3 | 4 | 5 (unused production capacity) | Production capacity [t/week] |
| Transportation and production costs [$] | ||||||
| 1 | 29+136 | 44+136 | 39+136 | 34+136 | 0 | 150 |
| 2 | 22+188 | 42+188 | 39+188 | 34+188 | 0 | 240 |
| 3 | 61+104 | 71+104 | 66+104 | 71+104 | 0 | 380 |
| 4 | 29+136 | 39+136 | 29+136 | 34+136 | 0 | 220 |
| Demand | 200 | 380 | 160 | 240 | 10 | 990 |


 Construction site
The production capacity (in regular business hours) of each production plant, expressed in tons of product per week, is shown in the last column of Table 1. Additional production is also possible in each production plant. Production costs for overtimes are presented in Table 2.
Table 2. Additional input data.
|
Precast production plant | 1 | 2 | 3 | 4 | 5 (unused production capacity) | Production capacity [t/week] |
| Transportation and production costs [$] | ||||||
| 1’ | 29+170 | 44+170 | 39+170 | 34+170 | … | 30 |
| 2’ | 22+235 | 42+235 | 39+235 | 34+235 | … | 20 |
| 3’ | 61+130 | 71+130 | 66+130 | 71+130 | … | 120 |
| 4’ | 29+170 | 39+170 | 29+170 | 34+170 | … | 30 |
| Demand | … | … | … | … | … | … |


 Construction site
|
|
|
During overtime production costs of production are higher by 25% in relation to the production costs in regular business hours. Transportation costs remain unchanged.
Дата добавления: 2019-11-16; просмотров: 200; Мы поможем в написании вашей работы! |

Мы поможем в написании ваших работ!