Accounting Profit versus Economic Profit
The accounting profit of a business is the business’s revenue minus the explicit cost and depreciation.
The economic profit of a business is the business’s revenue minus the opportunity cost of its resources. It is usually less than the accounting profit (or revenue – (imp + exp cost)
ZERO ECONOMIC PROFIT = NORMAL PROFIT
A business’s capital—its equipment, buildings, tools, inventory, and financial assets—could have been put to use in some other way. If the business owns its capital, it does not pay any money for its use, but it pays an implicit cost because it does not use the capital in some other way. Second, the owner devotes time and energy to the business that could have been used elsewhere—a particularly important factor in small businesses, whose owners tend to put in many long hours
implicit cost of capital, the opportunity cost of the capital used by a business; it reflects the income that could have been realized if the capital had been used in its next best alternative way.
The Role of Marginal Analysis
Marginal analysis involves comparing the benefit of doing a little bit more of some activity with the cost of doing a little bit more of that activity. The benefit of doing a little bit more of something is what economists call its marginal benefit, and the cost of doing a little bit more of something is what they call its marginal cost.
Why is this called “marginal” analysis? A margin is an edge; what you do in marginal analysis is push out the edge a bit and see whether that is a good move
The marginal cost of producing a good or service is the additional cost incurred by producing one more unit of that good or service.
Production of a good or service has constant marginal cost when each additional unit costs the same to
produce as the previous one.
For example, the cost of producing 1 cake is $1 so if you produce 10 cakes, the cost of producing still $1. This call constant marginal cost, the line connecting the midpoints, is horizontal.
But not all goods have constant marginal cost of production. For example, in the manufacture of a new model of car, production costs arise from the wages paid to workers to assemble the cars. It’s likely that workers are slow to assemble the very first car of the new model on the assembly line because of its unfamiliarity. But as they assemble the 2nd, then the 3rd, and so on, they learn more about the new model and reduce the assembly time required per car
these lead to decreasing marginal cost: each unit costs less to produce than the previous unit because it takes less of workers’ time to produce another unit. In this case, the marginal cost curve slopes downward
It’s also possible for marginal costs to rise. To understand this, suppose that autoworkers are now well experienced and producing 55 of the new-model cars each day, running the assembly line at a brisk pace. As they attempt to produce even more cars, they must speed up a bit more. But doing this takes a toll, in terms of a disproportionately greater number of mistakes and accidents. So, for example, the 56th car of
the day costs more to produce than the 55th car, and so on. This is an example of increasing marginal cost: each unit of a good costs more to produce than the previous unit. Increasing marginal cost is illustrated by an upward-sloping marginal cost curve. As a company tries to produce more and more output with a limited amount of equipment and workers, it will typically reach a point of increasing marginal cost for additional units. it’s not only possible for marginal costs to be decreasing or increasing, it’s also possible for the same good to have some units over which marginal cost is decreasing, and later have some units over which it is increasing
Marginal Benefit
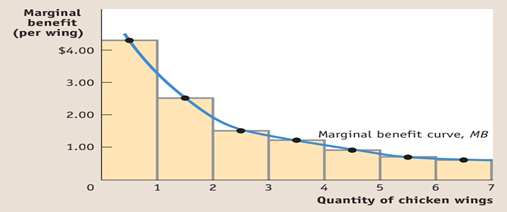
In general, the marginal benefit of producing a good or service is the additional benefit earned from producing one more unit of that good or service.
decreasing marginal benefit: each additional increase in portion size yields less benefit than the previous increase. Or, to put it slightly differently, with decreasing marginal benefit, the marginal benefit of producing more of the good falls as the quantity already produced rises.
Not all goods exhibit decreasing marginal benefit. In fact, there are many goods for which the marginal benefit of production is constant—that is, the additional benefit from producing one more unit is the same regardless of the number of units already produce
The marginal benefit curve shows how the benefit from producing one more unit depends on the quantity that has already been produced.
The optimal quantity is the quantity that generates the maximum possible total net gain.
For ex: I can buy 3 kfc wings and 5 wings. If I eat 3 im not full, but I eat 5 I will be way too full. 4 is enough for me. That’s optimal quantity
total cost versus marginal cost if total cost is rising, then marginal cost must also
be rising. Or if marginal cost is falling, then total cost must be falling as well.
Marginal Analysis
Marginal analysis involves comparing the benefit of doing a little bit more of some activity with the cost of doing a little bit more of that activity.
The optimal quantity is the quantity that generates the maximum possible total net gain.
For ex:
I can buy 3 kfc wings and 5 wings. If I eat 3 im not full, but I eat 5 I will be way too full. So 4 is enough for me. That’s optimal quantity
If the marginal benefit from the activity is greater than the marginal cost, doing a bit more will increase that gain. If the marginal benefit is less than the marginal cost, doing a bit less
will increase the total net gain. So only when the marginal benefit and marginal cost are equal is the difference between total benefit and total cost at a maximum.
A Principle with Many Uses
■ A policy maker must decide how much to spend on improving highways, improvements that reduce traffic deaths. He can make this decision by comparing the marginal benefit to society of saving a life versus the marginal cost of doing so. The optimal level of spending on highway improvements is the level at which the marginal benefit and marginal cost of saving a life are equal
Sunk Costs
A sunk cost is a cost that has already been incurred and is nonrecoverable. A sunk cost should be ignored in decisions about future actions.
You have gone through two years of medical school but are suddenly wondering whether you
wouldn’t be happier as a musician “I can’t give up now, after all the time and money I’ve put in.”
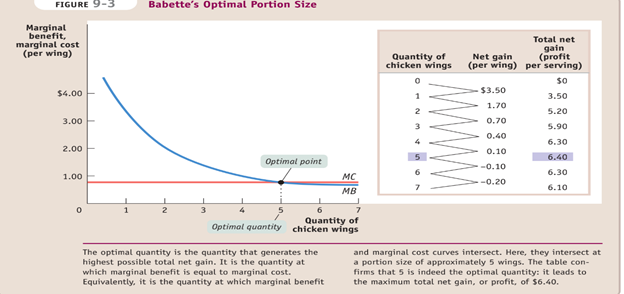
Principle of marginal analysis. It says that the optimal quantity of an activity is the quantity at which marginal benefit equals marginal cost. Graphically, the optimal quantity is the quantity of an activity at which the marginal benefit curve intersects the marginal cost curve.
The Concept of Present Value
Present value (PV) is the current value of a future sum of money or stream of cash flows given a specified rate of return. Future cash flows are discounted at the discount rate, and the higher the discount rate, the lower the present value of the future cash flows
Дата добавления: 2022-06-11; просмотров: 15; Мы поможем в написании вашей работы! |

Мы поможем в написании ваших работ!