Figure 3.1. Typical locations at the rear of an agricultural tractor for delivery of power to
МИНИСТЕРСТВО СЕЛЬСКОГО ХОЗЯЙСТВА
И ПРОДОВОЛЬСТВИЯ РЕСПУБЛИКИ БЕЛАРУСЬ
Учреждение образования
«БЕЛОРУССКИЙ ГОСУДАРСТВЕННЫЙ АГРАРНЫЙ
ТЕХНИЧЕСКИЙ УНИВЕРСИТЕТ»
АГРОМЕХАНИЧЕСКИЙ ФАКУЛЬТЕТ
Кафедра иностранных языков
Реферат
По дисциплине «Иностранный (английский) язык»
(темамагистерскогоисследования:
«Tractor Measurement and Data Acquisition System for Hydraulic Power, Draft Force, and Power Takeoff Torque»)
Специальность:
Выполнил: Шиш А.А.,
магистрант, 17 м
магистрант АМФ
________________________
(дата) (подпись)
Проверила:Дубина Л.П.,
ст. преподаватель кафедры
иностранных языков ________________________
(дата) (подпись)
МИНСК 2018
Contents
Introduction
Tractor Hydraulic Power Data Acquisition System.
1.1 Materialsandmethods
1.2 MeasuringDevices
2Tractor Drawbar Force Measurement and Validation.
2.1Materials and methods
2.3MeasuringDevices
3Tractor Power Take-Off Torque Measurement and Data Acquisition System
3.1 Materials and methods
3.2 PTO Torque Sensors
3.3Calibration Equipment
3.4DAQ Hardware and Software program
Conclusion
List of sources used
Introduction
Agricultural tractors are used throughout the year for various operations, utilizing
different implements. Tractors deliver power to implements via draft, hydraulic, and PTO
power. Several of these operations require at least two forms of tractor power, either
continuous power from the tractor (e.g. drawbar, PTO), or intermittent operations (e.g.
hydraulics).
Tractor performance is measured according to the standards of The Organisation for Economic Co-operation and Development (OECD) Code 2 for the official testing of agricultural and forestry tractor performance. All OECD approved tractors must complete a set of tests to determine tractor performance through the PTO, tractive performance as a result of drawbar draft force, and hydraulic power as separate tests. (OECD, 2016).
The mandatory test for hydraulic power required the hydraulic case fluid to be within a 5 degree tolerance of 65°C, and was to be stated in the report if control of temperature within this range could not be achieved. The test must also be conducted with engine at maximum speed and flow controls adjusted to achieve maximum flow, which is not always reasonable for normal operations.
Additional tests are included to measure PTOs that are designed to provide standard PTO speed at lower engine speeds (section 4.1.3.2, OECD 2016). The tests require maximum power to be measured at a speed equivalent to rated engine speed and at the engine speed giving standard PTO speed. Tractors unable to transmit full power of the engine through the PTO are tested under the type of coupling between the engine and the PTO, mechanical or non-mechanical coupling (section 4.1.4, OECD 2016). A mechanical coupling test will consist of a two-hour test at maximum power. Torque must be increased 20 per cent every five minutes for a period of no more than 60 seconds. Nonmechanical coupling tests include a two-hour test consisting of 2 separate one-hour tests sequentially and a series of tests at part loads. The first hour-test maximum power reported will be the average of a minimum number of six readings spaced evenly throughout the hour. The second one-hour test will be at the lowest engine speed which will maintain the PTO power from the first one-hour test at rated PTO speed. Power Take-off at part loads are completed with the governor control as set for the second onehour test. These loads must last 20 minutes minimally and be made according to the main PTO varying loads at RES.
Tractor Hydraulic Power Data Acquisition System
When instrumenting an agricultural tractor to obtain actual operational data from
the hydraulic system, mounting locations and space requirements are the most important design aspects of the system. Tractor hydraulic systems must endure the stress of intermittent use and frequent on/off cycling and are widely used for powering implements where mechanical or electrical energy are inefficient. Manufacturers install the entire hydraulic system in a relatively small space due to the power take-off shaft (PTO), drawbar, and 3-point hitch in the same area at the rear of the tractor (Fig. 3.1).
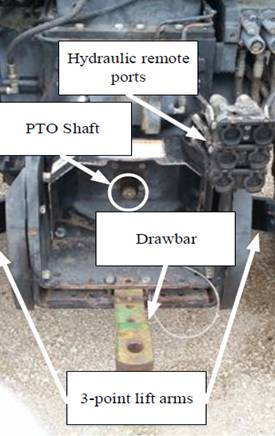
Figure 3.1. Typical locations at the rear of an agricultural tractor for delivery of power to
Implements.
Determining hydraulic power available for agricultural implements requires few
sensors; however, implementing such systems is challenging due to space constraints (Fig. 3.1). Implement hydraulic power consumption can be determined by measuring the pressure and the flow rate of the fluid delivered to the implement. Researchers have the option of installing a flowmeter between the main hydraulic pump and the hydraulic remote ports, or as an extension between the remote ports and the connected implement. As recommended by a flow meter manufacturer, a minimum upstream conductor length of 10 times the flowmeter port diameter and a minimum downstream conductor length of5 times the flowmeter port diameter was required (Flo-Tech, 2015). This is typically done to create laminar fluid flow in the measurement region to maximize the accuracy of flow rate readings. In a case where space is the limiting factor, having the recommended lengths of straight tubing in line with the flowmeter can be difficult. A previous study on agricultural tractor performance used a Hydrotecknik RE6 flow turbine installed in the main pump line upstream of the hydraulic remote block at the rear of the tractor (Burgun, et al., 2013). This approach limited the hydraulic implement power measurement accuracy by inducing the hydraulic system efficiencies into the measured data. The author’s approach also modified a tractor part which would require that the modification be undone after the project has ceased, to ensure proper functionality after the tractor returned to normal use.
This research presents a different approach for determining the hydraulic power
delivered to an implement by a tractor. The goal of this new approach was to minimize modifications to the tractor hydraulic system and allow the hydraulic power test system to mount on any tractor using standard ISO 5675 hydraulic couplers. Guidelines outlined in The Organisation for Economic Co-operation and Development (OECD) Code 2 were used for temperature and measurement tolerances. Installing a straight-line flow meter system on the rear of the tractor would not be appropriate to meet these objectives, as the hydraulic test apparatus needed to allow the 3-point lift arms and the PTO shaft to function unobstructed, without adding excessive length to implement hydraulic hoses (Fig. 3.1).
Materialsandmethods
A complete system to test the effect of tube bend configurations on pressure and
flow rate measurement accuracy was established. This system was comprised of an
agricultural tractor connected with an in-line Device Under Test (DUT) and a bench hydraulic measurement test apparatuses.
MeasuringDevices
Sensors with analog voltage signal output were selected to allow the most
flexibility and compatibility with data acquisition system (DAQ) hardware, and ease of expansion into a higher order system. Following this guideline, a turbine style flowmeter (Flo-tech Activa F6206-AVB-NN, Racine Federated Inc., Racine, Wisc.) which has thecapability of measuring 15 L min-1 to 303 L min-1 with an analog output of 0 V DC to 5 V DC was selected to work with the higher flow capacities of hydraulic systems on newer agricultural tractors. The turbine flowmeter measures the bi-directional flow rate and hence only one sensor was required in the system loop. Additional benefits of the sensor design were: supplementary internal flow straighteners on both sides of the turbine and the availability of ports for installation of temperature and pressure sensors (Flo-Tech, 2015). Analog pressure sensors are widely available in a variety of pressure ranges. The selected pressure sensor (OMEGA Px309, OMEGA Engineering Inc.) was capable of measuring 0 MPa to 34.5 MPa (0 psi to 5000 psi) with a voltage output range of 0 V DC to 5 V DC (OMEGA, 2014). The data acquisition interface between the sensor assembly and the data acquisition computer was a National Instruments (NI) myDAQ (National Instruments Corporation, Austin, Texas).
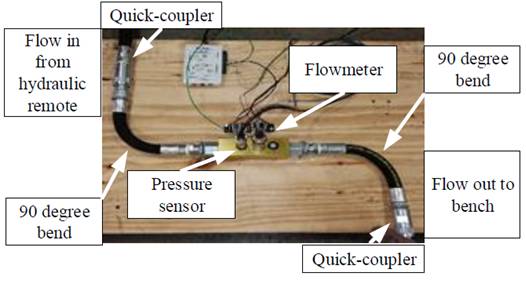
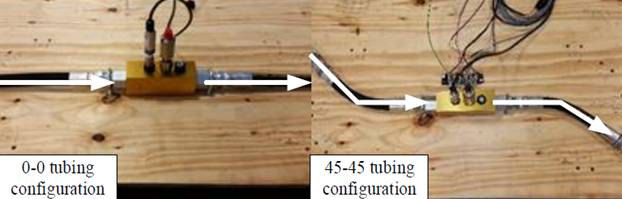
The flow meter ports (25.4 mm diameter) with SAE 16 threads, were connected to a series of reducers and adapters decreasing the dimensions from SAE 16 to 19 mm National Pipe Thread (NPT), and to 19 mm (¾ in.) medium pressure hydraulic hose (NRP-Jones Hydra-Lite II, 21.4 MPa maximum pressure rating) with ISO 5675 quickcouplers. The sensors and hoses were mounted to a plywood board using U-bolts as illustrated in figures 3.2a and 3.2b. The hose ends were able to be mounted with the hose in a straight-line configuration (0°), 45°, 90°, or any combination of these bends (Fig. 3.2a, 3.2b) using the plywood board and U-bolts; however, not all combinations were used for testing. The six tubing configurations selected were: 0-0, 45-0, 45-45, 90-0, 90-45, and 90-90. The reciprocal tubing configurations: 0-45, 0-90, 45-90 were assumedunnecessary due to symmetry. When organizing the tubing configurations as the maintreatments, an orientation was selected in which the inlet and outlet were parallel but have opposite direction. For example, the male inlet coupler of the DUT would insert into the rear-facing tractor remote port and the female outlet coupler of the DUT would have the same rear-facing direction as the tractor remote port. This orientation would allow the DUT to function as an extension hose installed on a tractor (Fig. 3.2a, 3.2b).
а.
b.
Дата добавления: 2018-04-15; просмотров: 204; Мы поможем в написании вашей работы! |

Мы поможем в написании ваших работ!