Research model and hypothesis
Measuring user acceptance is one of the most known approaches that have been used to discover the suitability of the provided system or application. In the field of user behavior, there are two models that have been used popularly namely: Technology Acceptance Model (TAM) [9] and the Unified Theory of Acceptance and Use of Technology (UTAUT) [10].
Different researchers consider different factors to measure users' acceptance. For example, in terms of e-banking, some researchers claimed that perceived ease of use, perceived usefulness, privacy and security are the most significant variables that might influence users’ adoption of the new services [11]. Meanwhile, Lee et al. (2002) argue that self-efficacy and social influence factors significantly influence perceived ease of use and perceived usefulness of using mobile Internet [12]. Consequently, there are several variables that appear in different theories and models which are highly similar to the factors used in the technology acceptance model [13]. In the next section, we are going to describe the factors used in this study to examine the citizens' acceptance of mobile government. In the following subsections, we are going to discuss the model factors and hypotheses which have been adopted by previous researches and the main approaches in the field of user acceptance.
Social Influence (SI)
The Theory of Reasoned Action (TRA) and the Theory of Planned Behavior (TPB) indicate that social influence (SI) is an important factor that determines technology usage and acceptance. SI seems to be more significant in the earlier phases rather than the later phases, to motivate the social and to study the culture needs before providing new technologies; will increase the usage and the acceptance of such technologies [14]. Consequently, the following hypotheses are proposed:
H1a
Social influence will have a positive effect on behavioral intention to use mobile government services.
H1b
Social influence will have a positive effect on usage behavior of mobile government services.
Cost of Service (CS)
To ensure the user acceptance of the price of service provided by mobile government compared to normal office services; the user benefits should be promoted and clarified, specifically when we propose new services to the market. Also, its value must be in reasonable prices in order to allow users to use such new services [15]. The cost of service might affect user’s access to the government services and information either positively or negatively. Also, the cost of services must reflect the value of the specific services.
H2
Cost of services will have a negative effect on behavioural intention to use mobile government services.
Perceived Trust in Technology (PTT)
PTT plays a vital role in reducing perceived risks of using new technologies, especially for transactions involving uncertainty. Since the adoption of mobile government is still in the early stage in some countries, the users are not clear about the technical capability of their service provider to provide m-service and about the security and reliability of the provided services [16]. Citizens' adoption behavior, preferences and requirements might be affected by cross-cultural characteristics. The mobile government adoption behavior should be analyzed focusing on cultural differences [17].
H3
Perceived trust in technology will have a positive effect on behavioral intention to use mobile government services.
Perceived Usefulness (PU)
PU focused on the importance of the provided information. Its concerns are on how meaningful, informative, relevant, important, significant and helpful is the information or services for user’s decision [18,19]. It is more about the benefit that user can earn from using specific service or application. Hence, the following hypothesis is proposed:
H4
Perceived usefulness will have a positive effect on behavioral intention to use mobile government services.
Perceived Ease of Use (PEOU)
PEOU is common factor employed widely in the investigation of the acceptance of new proposed technology [20]. In past studies’ results, PEOU has an indirect effect on behavioural intention to use new technologies and a direct effect on attitude toward using technology [19–21]. PEOU represents the user friendly, the ease of using services and the error free usage. Thus, the following hypothesis is proposed:
H5
Perceived ease of use will have a positive effect on perceived usefulness of mobile government services.
Behavioral Intention (BI)
BI is a major factor aims to predict the user intention to using the new technology again. This predictor assumes that behavioural intention will have a positive effect on attitude toward using the proposed technology [22]. A user’s intention to use the mobile government service is related to real usage of the services [14,23]. The user’s intention commonly is represent the user’s loyalty which is depends on several factors such as social influence, perceived trust and ease of use. Accordingly, the following hypothesis is proposed (see Fig. 1):
H6
Behavioral intention will have significant effects on the usage behavior of using mobile government services.
Research method
The research method explains a few aspects about the data collected for this study and the sample profile. In the next section, we are going to discuss the data collection method.
Data collection
Young citizens are the important target of this study due to their familiarity with the new technology of mobile devices and wireless technology. This study adopted a set of questionnaire raised by past research and studies, as well as concerns mentioned in the literature related to this study [14,24–26]. The survey items are measured using 5 point-Likert-scales ranging from strongly disagree to strongly agree.
The data collection for this study started in February 2016 in the city of Dammam in the eastern province of Saudi Arabia.

Fig. 1. Proposed research model.
The data were collected randomly from 468 citizens who have used, or have interest in using, mobile government. The researcher then conducted reliability tests for each construct to assess the goodness of measure, and indicate accuracy in measurement. The questionnaire consisted of 7 sections. The first section collected the demographic data while the next sections elicited information about the factors used in the research model (Questionnaire items are provided in the appendix).
Sample profile
As shown on the result of the data of the demographic distribution, 44% were males and 56% of the respondents were females demonstrating the sufficiency of the variety of responses in generalizing the results in both genders. Furthermore, the participants of this study include a variety of age level from 18 to above 65 years old. Table 1 shows that most of the respondents (72%) were in the age level of 18–34 years old. This indicates that this group of people represents the major ages of this study.
Fig. 2 explains how the citizens get information about the new services provided by the local governments. The results show that 25% of the citizens get information about the new services from the internet source, 22% from television and 20% from the newspaper. On the other hand, the lowest notification comes from magazine (11%), word of mouth (10%), radio (10%) and SMS messages (2%), respectively. Even though SMS nowadays is more popular as an easy way to reach the citizens, still it’s rarely used to notify citizens about new services.
Table 1.
Age and gender.
|
| User gender |
| % | ||
| Male | Female | Total | |||
| Age | Under 18 | 13 | 20 | 33 | 7 |
| 18–24 | 74 | 132 | 206 | 44 | |
| 25–34 | 61 | 69 | 130 | 28 | |
| 35–49 | 47 | 38 | 85 | 18 | |
| 50–65 | 9 | 5 | 14 | 3 | |
| Total | 204 | 264 | 468 | 100 | |
Fig. 2. Sources of mobile government services information.
Data analysis
AMOS is the most widely used Structural Equation Modeling (SEM) to validate the structured data. AMOS version 18.0 was used in this study to analyze the hypotheses generated. We conducted 2 types of analysis; the first was the analysis of the measurement model while the second was the analysis on the structural model as recommended by the literature [27].
Measurement model
The total reliability test of the 28 items (the questionnaire items available in the appendix) used in this study is 0.902. According to Hair et al. (2010), the reliability of 0.70 or above is considered to be acceptable data structured [28]. Hence, as can be seen from Table 2, the reliability test shows values above 0.70 for all constructs which shows well-structured data. Table 2 shows the mean value and the reliability test for all items and constructs (every construct contains 3 items minimum) used in this study.
Table 2.
Measurement model values.
| Construct | Items | Cronbach alpha | Mean |
| Cost of service | CS1 | 0.744 | 3.98 |
| CS2 | 3.93 | ||
| CS3 | 3.96 | ||
| Perceived trust on technology | PTT1 | 0.703 | 3.67 |
| PTT2 | 3.97 | ||
| PTT3 | 3.67 | ||
| PTT4 | 3.52 | ||
| Social influence | SI1 | 0.765 | 3.83 |
| SI2 | 3.85 | ||
| SI3 | 3.81 | ||
| Perceived ease of use | PEOU1 | 0.835 | 3.31 |
| PEOU2 | 3.45 | ||
| PEOU3 | 3.66 | ||
| PEOU4 | 3.59 | ||
| Perceived usefulness | PU1 | 0.744 | 3.57 |
| PU2 | 3.70 | ||
| PU3 | 3.64 | ||
| PU4 | 3.62 | ||
| Behavioral intention to use | BI 1 | 0.766 | 3.67 |
| BI2 | 3.56 | ||
| BI3 | 3.63 | ||
| BI4 | 3.54 | ||
| Usage behavior | USE1 | 0.772 | 3.05 |
| USE2 | 3.09 | ||
| USE3 | 3.36 |
The structural model
Using the SEM analysis technique provides the researchers with different methods of analysis such as confirmatory factor analysis, latent variable analysis, path analysis, linear structural relation analysis and covariance structure analysis [27]. Therefore, SEM is the best for analyzing the strength of casual relationship of the constructs. Table 3 below summarizes the fit indices used to observe the structural model as recommended by the previous studies [29].
The result in Table 3 shows that all measures are above the recommended values which indicate a good model fit. The model in Fig. 3 below shows the regression test of the model hypothesis which indicates that the stringer effect on citizens’ behavioral intention to use mobile government services is the social influence (SI) with value of 0.34, followed by perceived trust in technology (0.28) which indicates a very strong effect on citizens’ intention to use mobile government services. The paths analysis shows that all model hypotheses are supported and have significant affect at the 0.01 level.
Table 3.
Results of fit index model.
| Fit indices | Value | Benchmark value |
| P | 0.111 | ≥0.05 |
| CMIN (χ2)/DF | 1.880 | ≤3.00 |
| GFI (Goodness of Fit Index) | 0.995 | ≥0.90 |
| RMSEA (Root Mean Square Error of Approximation) | 0.043 | ≤0.08 |
| CFI (Comparative Fit Index) | 0.997 | ≥0.90 |
| RFI (Relative Fit Index) | 0.970 | ≥0.90 |
Discussion
Measuring user acceptance of the provided services is not a question that we can easily answer but it's a variable that plays an important role in the user decision which needs to be examined. These variables could be money or social or it could be the service itself, e.g. the service is not important, not useful, not easy to understand or use. Social Influence (SI) commonly plays an important role in influencing the individual’s behavior of accepting new technologies. SI is one of the important variables that have a large share among technology adoption studies. Social factors or culture reflections heavily influence individuals who may or may not accept the new technology based on their beliefs and social background [30].
The result from the path analysis shows that among all independent variables, social influence has the strongest effect on citizen’s intention to use mobile government (C.R = 0.34). It also affects the actual use behavior of the mobile government with regression value of 0.28. Those results give the social influence factor the first priority among the factors that might affect user acceptance of mobile government. The second priority is given to perceived trust in technology, which affects user intention significantly in regression value of 0.30. In contrast, the cost of services is negatively affecting the citizen’s intention to use mobile government. The value of −0.18 indicates that, if the cost of services decreases that means the citizens intention will increase.
According to the results, perceived usefulness has a significant influence on user intention to use mobile governments (C.R = 0.17). Also, the findings confirmed that perceived ease of use has significant effect on behavioral intention (C.R = 0.18) which is in line with TAM’s results in previous studies. Thus, the findings indicate that behavioral intention to use mobile government services is affecting the actual usage behavior (C.R = 0.20).
These results are in accordance with AlAwadhi and Morries (2009), TAM and UTAUT studies [21,31,32]. These results are contrary to what Liu et al. (2014) who stated that future research should be cautious when using TAM and perceived usefulness to interpret the service adoption in mobile government context [33].
The path analysis indicates that all independent factors have significant positive correlation. Among those factors, the largest correlation is between social influence and perceived trust (0.66). This indication shows that trust can change the society to use mobile government more and if the trust of technology goes lower, the social influence will go low too and that will affect the citizen’s intention to use mobile government negatively. Also, cost of service is correlated positively with social influence (0.63). This large correlation shows that if the cost of service is cheap the society will talk about it more and the intention to use mobile government will be higher.
The implications of this study are directed to implementers and developers or governments. These bodies need to guarantee the usefulness, the ease of using mobile government and the secured trusted technology with lower cost of accessibility. Those factors will enhance the actual users' use of mobile government and will attract the citizen’s intention to use mobile government. That will enhance the government’s performance and save the cost and time of both citizens and organizations. Gaining the citizens trust is the key that motivate the society to use and talk about the mobile government and that will increase the intention to use.
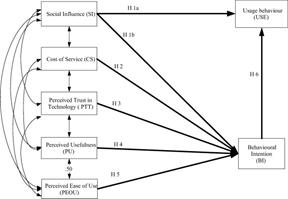
Fig. 3.
Hypothesis testing.
This study contributes to the previous studies by analyzing the effect of social influence, perceived usefulness, cost of service, perceived trust and perceived ease of use on behavioral intention to use mobile government. At the same time, this effect has been influenced indirectly by the correlations between those independent variables which influenced the total effect on behavioral intention to use mobile government, and the usage behavior. In our future research, we are going to study the mediated factors that might affect the citizens' acceptance of mobile government.
Conclusion
This study has critically reviewed and explored the existing technology acceptance models and theories. The related important factors of the existing technology acceptance models are discussed in view of developing mobile government services and then integrated into the proposed research model in order to measure the user’s acceptance of mobile government services. The proposed model attempts to measure the acceptance of mobile government among citizens using SEM AMOS18 to test the research hypotheses. The results of this research show that independent variables (perceived usefulness, social influence, cost of service, perceived ease of use and perceived trust) has significant direct effect on the citizens’ behavioral intention to use mobile government and indirect effect on the actual use behavior. Among all those affects, social influence has the strongest effect on the user’s intention to use mobile government. These implications indicate that perceived trust in technology is the key for gaining the social intention to use mobile government services. Furthermore, we hope that the implications of this study will help the public organizations and governments to gain more understanding about what drives the development and acceptance of mobile government services. Since this research is limited to a few factors, we believe that measuring the effect of perceived risk in the user acceptance of mobile services will bring valid result for the future research.
Appendix A. The questionnaire items used in this study to test the research hypotheses
| Constructs | Items | |
| Cost of service (CS) | CS1 | I think the equipment (e.g., mobile device) cost for M Government services is expensive |
| CS2 | I think the access cost for M Government services is expensive | |
| CS3 | I think the transaction fee for M-Government services is expensive | |
| Perceived trust on technology (PTT) | PTT1 | I would not have to give away personal information to use the M-Government service |
| PTT2 | I would expect that the quality of the M-Government service would be good | |
| PTT3 | I would be able to control the costs of M-Government service | |
| PTT4 | I trust the technology that M-Government services are using | |
| PTT5 | I trust the ability of M-Government services to protect my privacy | |
| PTT6 | Using M-Government services is financially secured | |
| PTT7 | I am not worried about the security of M-Government services | |
| Social influence (SI) | SI1 | People who can influence my behaviour would think that I should use M-Government services |
| SI2 | People who are important to me would think that I should use M-Government services | |
| SI3 | People who are important to me would find using M-Learning services beneficial | |
| Perceived Ease of Use (PEOU) | PEOU1 | I found M-Government services easy to use |
| PEOU2 | Learning to use M-Government services would be easy for me | |
| PEOU3 | M Government services are clear and understandable | |
| PEOU4 | It would be easy for me to get services I need from M-Government services | |
| Perceived Usefulness (PU) | PU1 | Using M-Government services helps me to accomplish things more quickly |
| PU2 | Using M-Government services makes my life easier | |
| PU3 | I find M-Government services useful to my life | |
| PU4 | Using the M-Government services would increase my productivity | |
| Behavioral Intention (BI) to use | BI 1 | I intend to use M-Government services to do my work |
| BI2 | I will return to M-Government services often | |
| BI3 | I intend to use M-Government services frequently to get services from government | |
| BI4 | Given the opportunity, I will use M-Government services | |
| Use Behavior (USE) | USE1 | I often use M-Government service frequently |
| USE2 | I use the mobile services whenever appropriate to do my work | |
| USE3 | I use the mobile services a lot in my work | |
Дата добавления: 2019-09-08; просмотров: 313; Мы поможем в написании вашей работы! |

Мы поможем в написании ваших работ!