Untreated HIV versus HIV-suppressed (12 months of cART)
Patient population B
The characteristics of the HIV-1-infected patients selected to compare baseline metabolic profile to the HIV-suppressed profile after 12 months of therapy (population B) are presented in Table 2. This is an independent population from the untreated HIV-infected population A introduced in Table 1. Most of the patients had a male gender. Mean CD4+ T-cell count at the start of cART was of 267 × 106 cells/L with an IQR of 224 × 106. There was a large heterogenicity in viral load with a median of 5.5 × 10⁴ copies/ml and an IQR of 2.7 × 10⁵. 89% of the patients were of European descent. Four patients had a blip in their viral load at 12 months on cART: their viral loads were 53, 73, 103 and 130 copies/ml. Most patients used Abacavir in combination with Lamivudine as the backbone in cART (n = 25). The patients who only used NRTI’s all used the combination Abacavir with Lamivudine and Zidovudine (n = 8) except for one patient who used Abacavir/Lamivudine with Stavudine. The protease inhibitors (PI) used were Lopinavir (in combination with ritonavir) (n = 4), Atazanavir (n = 1) and Darunavir (n = 1). The NNRTI’s used were Efavirenz (n = 8), Nevirapine (n = 4) and Rilpivirine (n = 1). Five patients used a statin. The incidence of dyslipidaemia or the use of lipid-lowering therapy (statins and/or fibrates) remained stable during the first year of cART.
Metabolic consequences following cART treatment of HIV patients
Next, we evaluated the metabolic changes associated with 12 months of cART treatment, as well as HIV suppression in the longitudinal patient population B. cART treatment of the HIV patients resulted in viral suppression with undetectable plasma HIV RNA levels and partial restoration of CD4+ T-cell counts in the blood (Table 2). Eight HIV infected patients were HCV positive, but were untreated for HCV during the 12-month period and were not excluded from the analyses. The untreated HCV infection had minimal impact on the metabolic findings as can be seen in see Supplementary Fig. S2. Evaluation of biogenic amine levels in paired plasma samples showed significantly increased methionine sulfone, histidine and tryptophan levels during the therapy period as compared to the baseline samples (untreated HIV), whereas pipecolic acid, 3-aminoisobutyric acid, and kynurenine showed significantly decreased levels during the therapy period as compared to the baseline (Fig. 2a, Supplementary Table S4). Significant metabolites were identified by having a false discovery rate adjusted p-value < 0.05 using a paired t-test approach. The K/T ratio revealed significantly decreased IDO activation after 12 months of cART (see Supplementary Fig. S3), however, the ratio between tryptophan and serotonin showed no significant changes. The neurotransmitter dopamine and metabolite α-aminobutyric acid correlated with CD4+ T-cell counts during 12 months of therapy (see Supplementary Fig. S4A).The lipid profile showed an overall increasing trend reflecting higher levels after the 12-month cART period compared to their baseline levels, as can be seen in Fig. 2b. Predominantly it was the phosphatidylcholine metabolism responding to cART with significantly increased levels of 9 phosphatidylcholine species, 8 plasmalogen phosphatidylcholine, and 3 lysophosphatidylcholine species after 12 months of cART compared to baseline values prior to starting of cART. Furthermore, 7 sphingomyelin metabolites, together with one phosphatidylethanolamine species, two plasmalogen phosphatidylethanolamine, and a cholesterol ester were also increased after 12 months of cART compared to their baseline values. Furthermore, the phosphatidylcholines also revealed a positive association with CD4+ T-cell counts of the patients (see Supplementary Fig. S4B).Finally, we compared changes in the signalling lipid profiles in patient plasma after 12 months of cART to their untreated HIV levels and found no significant changes.Plasma immune-metabolic networks of HIV infection and therapyPlasma levels of cytokines and immune mediators are a commonly used readout reflecting systemic immune activity23,24. To correlate metabolite profiles in plasma with immune activity, we determined in subsequent plasma samples of the same patients the levels of the infection markers IP-10, sIL-2R, and D-dimer, the inflammation markers IL-6, IL-10, IL-21, IL-18, and MCP-1, and the soluble exhaustion markers sPD1, sPD-L1, sPD-L2, and sTIM3. Significantly enhanced plasma levels of D-Dimer, IL-18, MCP-1, sPD-L2, sTim-3, IP-10, sIL-2R, CRP, and sTNF-RII were observed in patients with untreated HIV as compared to non-HIV infected controls (Population A), and are shown in Supplementary Fig. S5. The other mediators tested were below the limit of detection of the assay, which included IL-6, IL-10, IL-21, sPD1, and sPD-L1Evaluating the changes in the immunological parameters in population B after the 12 months cART period revealed an immunological picture of effective therapy shown in Supplementary Fig. S6. Markers of infection revealed that after the initiation of cART, both plasma IP-10 and sIL-2R levels were reduced significantly. Furthermore, initiation of cART reduced the levels of the inflammation marker IL-18 whereas MCP-1 levels remained unchanged when comparing baseline to 12 months of cART. An improvement in markers of exhaustion was found with reducing levels of both sPD-L2 and sTIM3 after 12 months of cART.Next, we constructed immune-metabolic correlation networks respectively for the controls and the patients with an untreated HIV infection from population B using the absolute of levels of metabolites and immune mediators. Figure 3 presents these three immune-metabolic correlation networks showing all correlations with a strict p-value cut-off of p < 0.01. Comparing Fig. 3a (the control network) to Fig. 3b (the untreated HIV network) difference is seen in the interactions between the two networks. The control network revealed isolated clusters with IP-10 and IL-18 correlating to different lipid classes, sIL-2R and sTNF-RII correlated together and D-Dimer, sTIM3 and MCP-1 showing correlation. Comparatively the untreated HIV shows positive correlations between sTIM-3, sIL-2R, IP-10 and sPD-L2 with D-Dimer connecting the network through sTIM-3, revealing correlations between markers of infection and exhaustion. In both networks, sTIM-3 and D-Dimer revealed strong positive correlations, while in the untreated HIV patients sTIM-2 also showed strong interactions with phospholipids as well as lysophospholipids. Furthermore, in untreated HIV patients MCP-1 correlated strongly to several triglyceride species compared to the control network where MCP-1 correlate only to D-Dimer. Interestingly, in the control network, IL-18 showed strong interactions with triglyceride species, whereas IL-18 was correlated to only 5,6-DiHETrE in the untreated HIV patients.
|
|
|
|
|
|
|
|
|
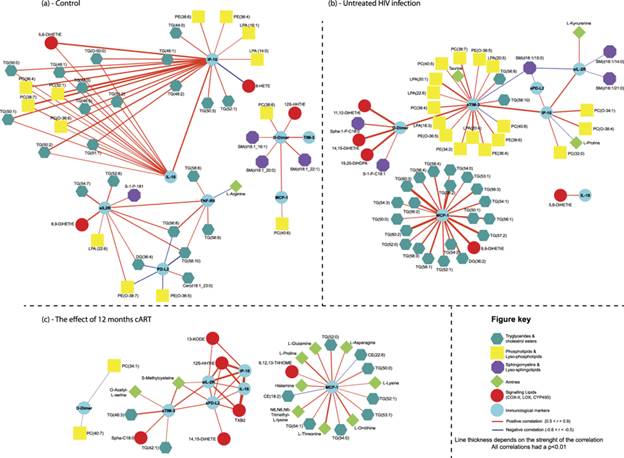
Immune-metabolic networks of controls, untreated HIV and the influence of cART. (a) Control immune-metabolic correlation network based on correlating the absolute levels of plasma metabolites and plasma cytokines in the control group. (b) Untreated HIV immune-metabolic correlation network based on correlating the absolute levels of plasma metabolites and plasma cytokines in the untreated HIV group (Population B). (c) The immune-metabolic correlation network following 12 months cART. Using the paired samples of population B, the relative change in levels of 12 months’ cART compared to their baseline levels (untreated HIV sample) were determined for plasma metabolites and cytokines and subsequently correlated. For all three networks, spearman correlations were performed and significant correlations were defined as having a strict p-value (two-tailed) < 0.01.
Next, for the influence of cART on HIV infection, we constructed immune-metabolic correlation network based on the relative change in levels of metabolites and immune mediators in the paired plasma of the patients on 12 months cART versus their untreated HIV levels. As shown in Fig. 3c, the correlation network revealed distinct immune-metabolic interactions. Firstly, changes in sTIM-3, sIL-2R, IP-10, sPD-L2 and IL-18 positively correlated with each other, with D-dimer becoming disconnected from the core network. Again, MCP-1 showed minimal interactions to other immune mediators in the panel: changes in triglyceride levels correlated strongly to changes in MCP-1 levels as did some amine metabolites, while changes in two cholesterol-esters showed negative correlations. Furthermore, cART diminished the interaction of sTIM-3 with the phospholipids and lysophospholipids which were found in untreated HIV-patients.
Discussion
The data presented in this study provide some insight into the distinct effects of HIV and cART have on metabolism. Through identifying immune-metabolic pathways altered during untreated HIV infection, we can follow these pathways during the first 12 months after commencing cART in the same patients, monitoring their responses. In line with earlier research, we found decreased glutathione, taurine and tryptophan levels as well as upregulated IDO activity in untreated HIV patients compared to HIV-seronegative controls8,25,26. Also, increased levels of highly unsaturated long-chain triglycerides27 and decreased levels of sphingomyelin species characterized an untreated HIV Infection compared to controls. After the initiation of cART, changes in the lipid metabolism were primarily found within the phospholipids while the highly unsaturated triglyceride species remained elevated. A noteworthy metabolic finding is the unresponsive signalling lipid profile, showing minimal changes after the first 12-month cART period. Signalling lipids including eicosanoids are metabolically derived immunological mediators and might represent a metabolic reflection of the immune competence of HIV-infected patients28,29. The unresponsive signalling lipid metabolism could result from the sequestering of their polyunsaturated fatty acid precursors into triglyceride species. Cassol et al. reported decreased eicosanoid levels specifically 5-hydroxyeicosatetraenoic acid (5-HETE), prostaglandin B2, prostaglandin E2 and thromboxane B2 in cART-treated HIV-positive individuals compared to controls1. Since eicosanoids also play an essential role in immunological crosstalk30 it could help to explain the dysregulated immune surveillance and exhausted phenotype persisting in virally suppressed patients31.
|
|
|
Studying the immune-metabolic networks revealed that the initiation of cART disconnected the interactions between kynurenine and sIL-2R as well as sTIM-3’s interactions with phospholipids and lysophospholipids. Thus, HIV suppression through cART attenuates the pro-inflammatory sIL-2R and IDO pathways differently, since it has been reported that IDO activity remains significantly increased compared to controls even after 24 months of cART32. Secondly, cART might contribute to an exhausted immune phenotype through dysregulating the phospholipids (increased during the first 12 months of cART) and their interactions with sTIM-3 interactions. Further, IL-18, a pro-inflammatory cytokine found elevated in advanced stages of HIV infection33, showed strong correlations to triglyceride levels in the control population. The role of IL-18 in cardiovascular disease and the metabolic syndrome, as well as its association with triglyceride levels, has been previously described34,35. Comparatively, in the untreated HIV infected population, the triglyceride species showed a strong correlation to MCP-1 levels and not to IL-18. Initiating 12 months of cART was unable to nullify this interaction, revealing that changes in triglyceride levels still strongly correlated to those of MCP-1 in the paired patient samples. Mihăilescu et al., found that the prevalence of insulin resistance and metabolic syndrome was higher in HIV suppressed patients compared to virally active patients, and that the levels of MCP-1 correlated to both these co-morbidities36, supporting our findings.
Disentangling the mechanism behind the observed metabolic changes during an HIV infection and therapy is a complex task. However, the importance of this task is stressed by the findings in this study that even 12 months of cART does not attenuate metabolic dysregulation. This is opposed to the finding that immune activation in HIV-infected patients is normalized during treatment with cART for this same period, as we also previously showed33. Sustained immune activation thus is not the complete answer to what causes co-morbidity in HIV-infected patients, like neurocognitive disorders and cardiovascular disease. Although cART has become increasingly effective over the last years, but as we show here, is not enough to fully restore the metabolic profile of HIV-suppressed patients to normal.
This finding warrants further research, to contribute to unravelling the metabolic pathophysiological pathways in HIV comorbidities, with multiple findings in this study able to generate testable hypothesis regarding HAND and CVD. With respect to HAND, the following questions arise applicable to both untreated HIV and cART-treated HIV patients. (1) How does the sustained elevated Indoleamine-2,3-dioxygenase (IDO) activity (the rate-limiting enzyme catabolizing L-tryptophan into neurotoxic metabolites and not serotonin) contribute to neurological disorders? (2) What is the pathological mechanism underlying a dysregulated urea cycle during an untreated HIV infection? Since disorders of the urea cycle are known to manifest with neurological implications due to hyperammonemia37. Similarly to HAND, questions relating to CVD, an important cause of morbidity and mortality in untreated and suppressed HIV-infected patients, arises38,39. (3) Do the significant correlations between changes in triglycerides and MCP-1 levels, expose an alternative mechanism contributing to the development of CVD, independent of IL-18? (4) How does an unresponsive eicosanoid metabolism contribute to CVD, since they play an important role in normal cardiovascular function?40,41,42. Potentially with the answer to these questions, morbidity, and mortality in HIV-infected patients because of the non-communicable disease can be further diminished.It is important to note that in our study the time of follow-up of these patients was too short to draw conclusions about causality. The use of targeted metabolomics platforms in conjunction with other omics technologies would provide a unique opportunity to study HIV pathogenic mechanisms, as well as to identify biomarkers relevant to co-morbidities relating to both HIV and the use of ARVs. Studies investigating the metabolic dysregulation of HIV infections and exposure of antiretrovirals can be further strengthened by investigating paired longitudinal samples with a known outcome. Furthermore, these techniques could also proof complementary to antiretrovirals pharmacokinetic studies currently in clinical trials.It is important to mention that due to the retrospective nature of the part of our study in which we compared cART naïve HIV-infected patients with their samples after 12 months of therapy, it is difficult to ascertain whether all blood samples were processed identically, thereby introducing some variation in outcome parameters. Further, the duration of the HIV infection prior to starting cART is not known of these patients. Apart from the HIV infection, other factors might play a role in metabolic changes, for instance, smoking habits, aging, and timing of sampling of the material. Also, we have no data on the fasting state of both the patient as well as the control population, however, because the samples of the included patients were taken during routine outpatient visits and blood donors, in general, are instructed not to donate blood in the fasted state, it is safe to assume that both groups were in a post-prandial state. Food intake can affect metabolites and phospholipid levels43,44, but also multiple large population studies have shown that changes in plasma lipids and lipoproteins change only modestly during the day, in response to habitual food intake45,46. Further, although sub-analysis of 12 months cART according to PI or NNRTI used did not show differences in lipid profiles, the choice of the specific components of the cART regimen might be a significant factor or influence on the metabolic profile of a patient in the long run. For instance, abacavir use, which is associated in the literature with an increase of CVD47,48. Population A and B differed significantly from each other regarding mean CD4+ T-cell counts and cytokine profiles, probably due to the fact that Population A was selected to be compared to a non-HIV infected, healthy control population and therefor selection criteria was more strictly defined than those for population B, where the patients were their own controls. In population B, five patients were using statins during the first year of cART, of which four were already receiving statin therapy prior to the start of cART. We were unable to identify any trends in the data indicating that lipid profiles were skewed based on the use of statins. Eight patients were coinfected with HCV, which may have had an effect on the comparison of the untreated patients compared to controls. However, during this study, none of the patients was treated for HCV, thus this was a stable factor in the comparison between untreated HIV and 12 months of cART. A sub-analysis leaving out the HCV coinfected patients showed minimal impact on the outcome. In this study, we were not able to include a sample of the control patients after one year. However, to determine the baseline stability of the metabolic/immune network, further studies are needed with follow-up samples of a control population.
In conclusion, in our study, we found significant changes in the metabolism relevant of untreated HIV infected patients and after 12 months cART. Additional to this finding, and potentially even more important is the finding that cART alone does not restore these changes. Further insight into the metabolic changes caused by HIV infection is warranted to optimize therapy in addition to cART for this patient population.
Methods
Дата добавления: 2019-01-14; просмотров: 252; Мы поможем в написании вашей работы! |

Мы поможем в написании ваших работ!